For the past year, I have been working on the Mendenhall River GLOF problem. This post is a short introduction to the challenge and to the public data behind it: USGS gauges and cameras, National Weather Service forecasts, and post-event reports. I have tried to separate what those records show directly from what remains uncertain.
The short version
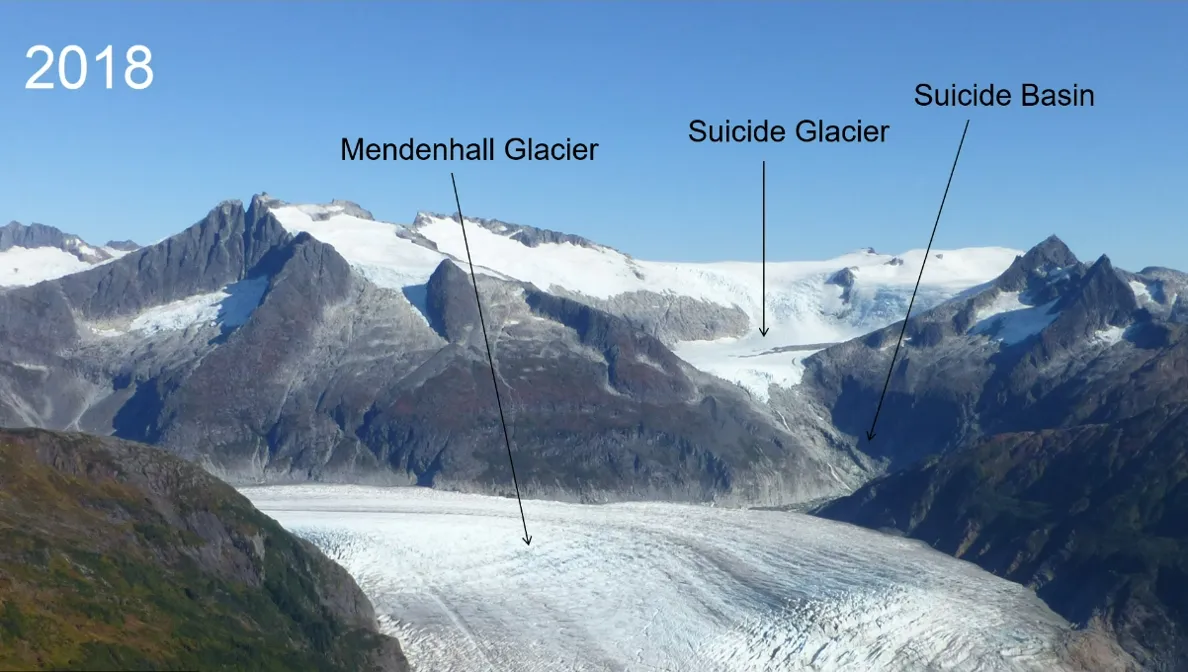
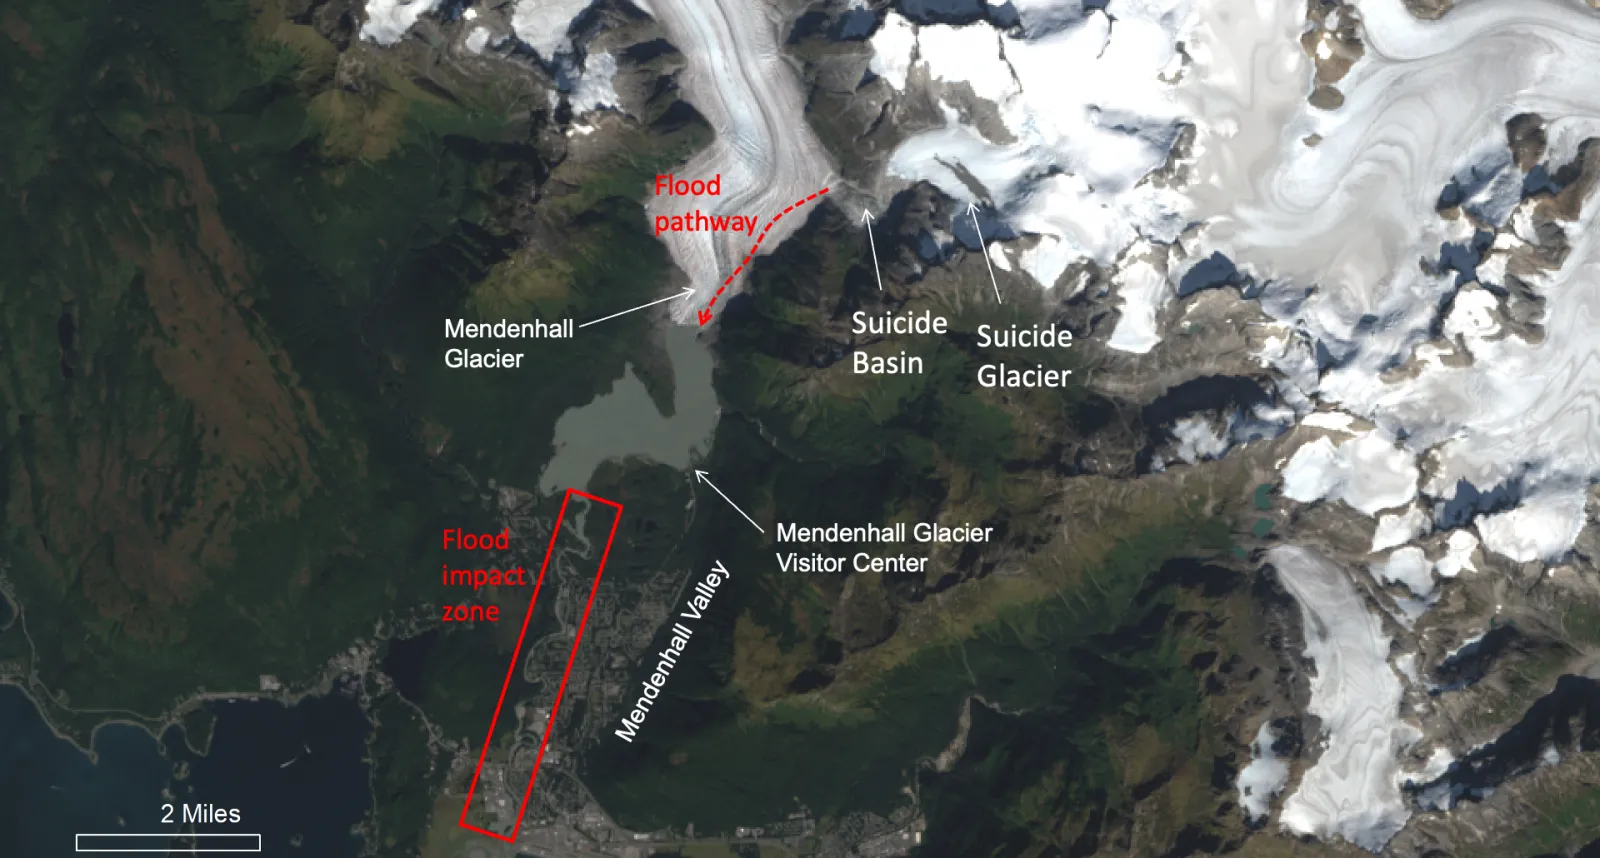
A glacial lake outburst flood, or GLOF, is a rapid release of water from a lake held back by glacier ice, sediment, or both. Juneau's recurring GLOF begins in Suicide Basin, where seasonal meltwater, rain, and snowmelt are impounded by Mendenhall Glacier. When water gains access to a changing path through or beneath the ice dam, the basin can drain quickly into Mendenhall Lake and then the Mendenhall River.
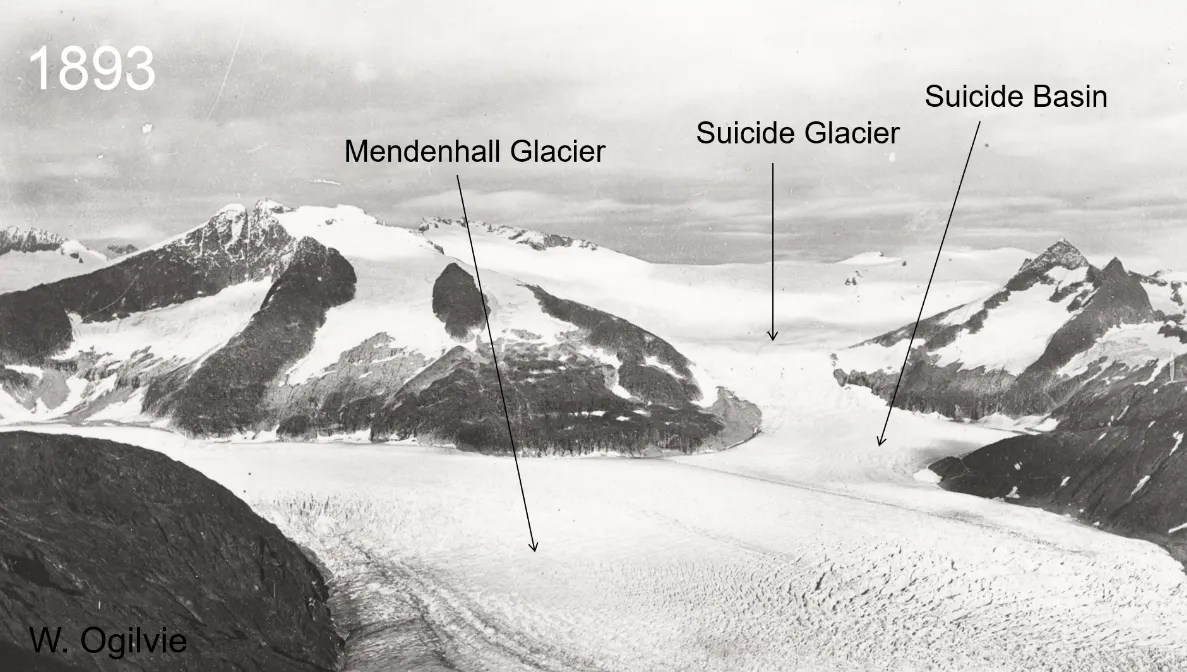
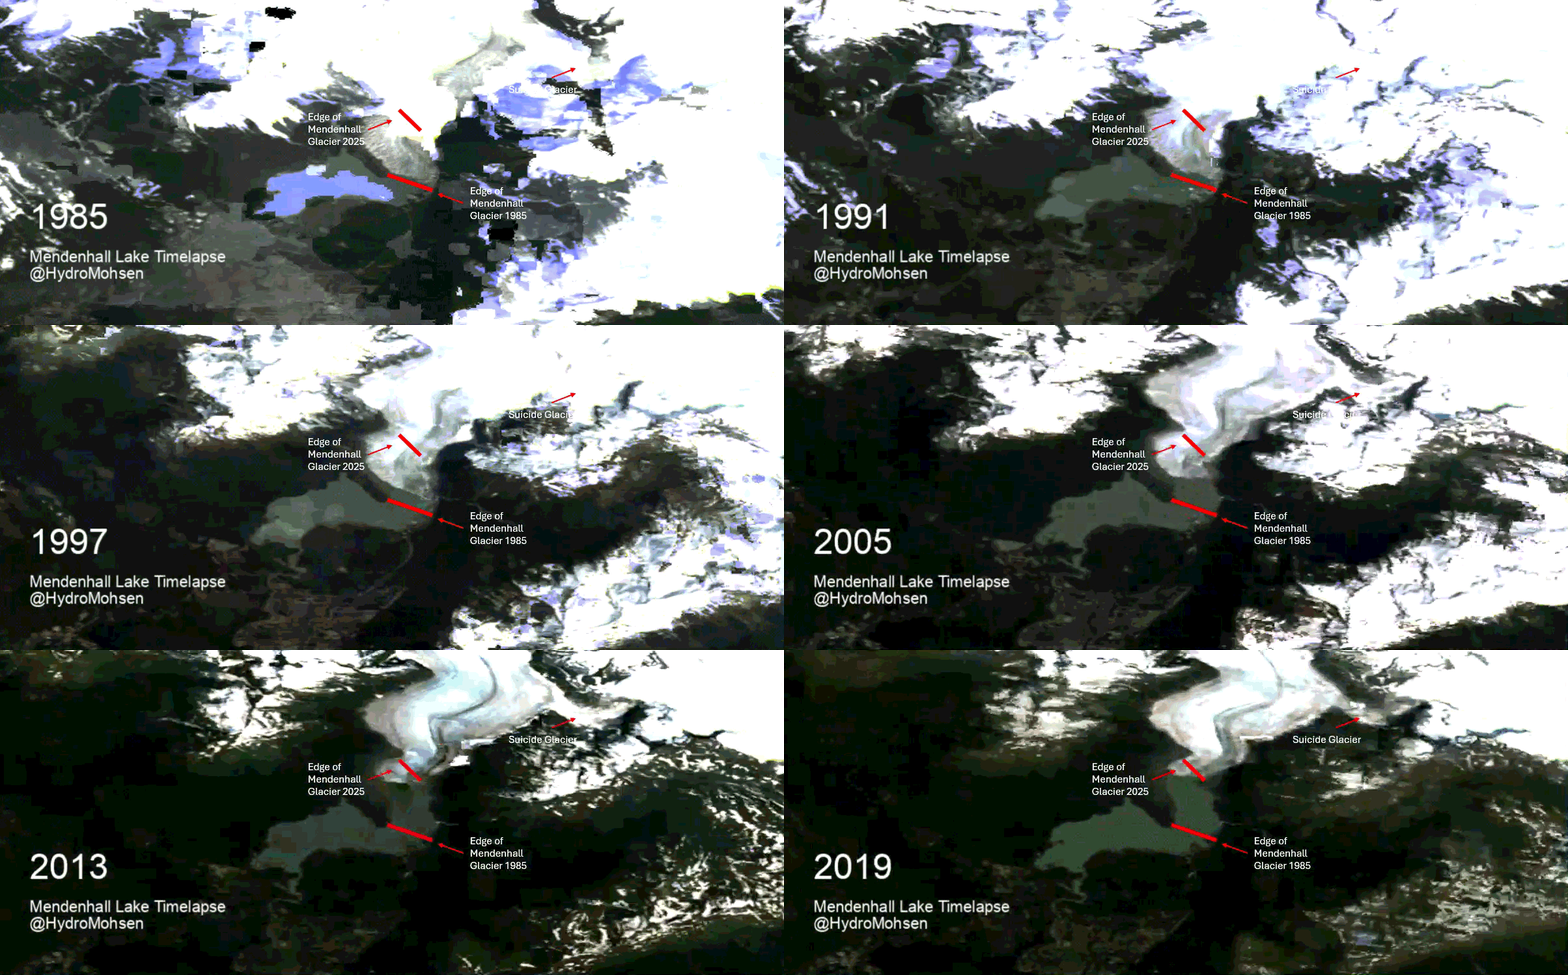
The root cause of Mendenhall GLOF is a changing glacier landscape rather than a single switch that flips every August. Suicide Glacier detached from Mendenhall Glacier entirely in 2006, leaving a depression that can store water, while Mendenhall Glacier continues to block its outlet. Glacier thinning, ice motion, melting, calving, rain, snowmelt, and the evolving drainage path all matter. Climate warming is the background driver of this deglaciation, but the size and timing of any one flood depend on the local ice geometry and weather that year. One of the best physical accounts is the peer-reviewed study by Kienholz and colleagues.
The technical vocabulary
| Term | What it means here | Why it matters |
|---|---|---|
| GLOF | A rapid glacial-lake release, sometimes called a jokulhlaup. | The flood source is stored water, not rainfall alone. |
| Ice dam | Glacier ice blocking a basin outlet. | It can thin, move, calve, melt, and leak. Its capacity is not fixed. |
| Hydraulic head | Water's potential to flow because of its elevation and pressure. | As the basin water level falls, the force driving drainage can change. |
| Subglacial conduit | A water pathway beneath glacier ice. | It can enlarge quickly, constrict, shift, or become blocked during one event. |
| Hydrograph | A graph of streamflow or stage through time. | The river hydrograph combines the basin release with rainfall, snowmelt, glacier melt, and temporary storage in Mendenhall Lake. |
| Stage | Water-surface height above a station's local reference level, also called gage height. | Stage is not water depth, stored volume, or a direct measure of discharge. |
| Discharge | The volume of water passing a cross section per unit time. Here it is reported in cubic feet per second, or cfs. | It describes the flow rate that drives flood hazard. |
| Rating curve | The site-specific relation used to convert measured stage into discharge. | The relation can change after scour, deposition, debris, or channel change. |
| Digital elevation model, or DEM | A map of surface elevation made from survey data or imagery. | A current DEM is needed to convert basin water level into a defensible volume estimate. |
| Provisional data | Real-time data that USGS has not yet completed for publication. | It can be revised after field inspection, quality control, and rating-curve review. |
How the river record changed after 2011
Before July 2011, the downstream gauge had never recorded a GLOF, and the river's peak of record was about 16,000 cfs from a September 1995 rainstorm. Since 2011, Suicide Basin has drained approximately 48 times, with release volumes up to 55,000 acre-feet and river flows as high as approximately 50,000 cfs. Until August 2023, every one of those releases drained only part of the basin. The 2023, 2024, and 2025 events then drained essentially all of it, and each rewrote the flood record. A river that did not have this hazard fifteen years ago now experiences it annually, which is why the National Weather Service and its research partners monitor the basin all season. The 2025 federal post-event report tabulates this history.
Figure 1 places the recent floods in the longer instantaneous-flow record. Nearly four decades of measurements show the river's regular summer rhythm and a handful of rain-driven spikes, followed by a cluster of peaks since 2023 that stand above the rest of the record.
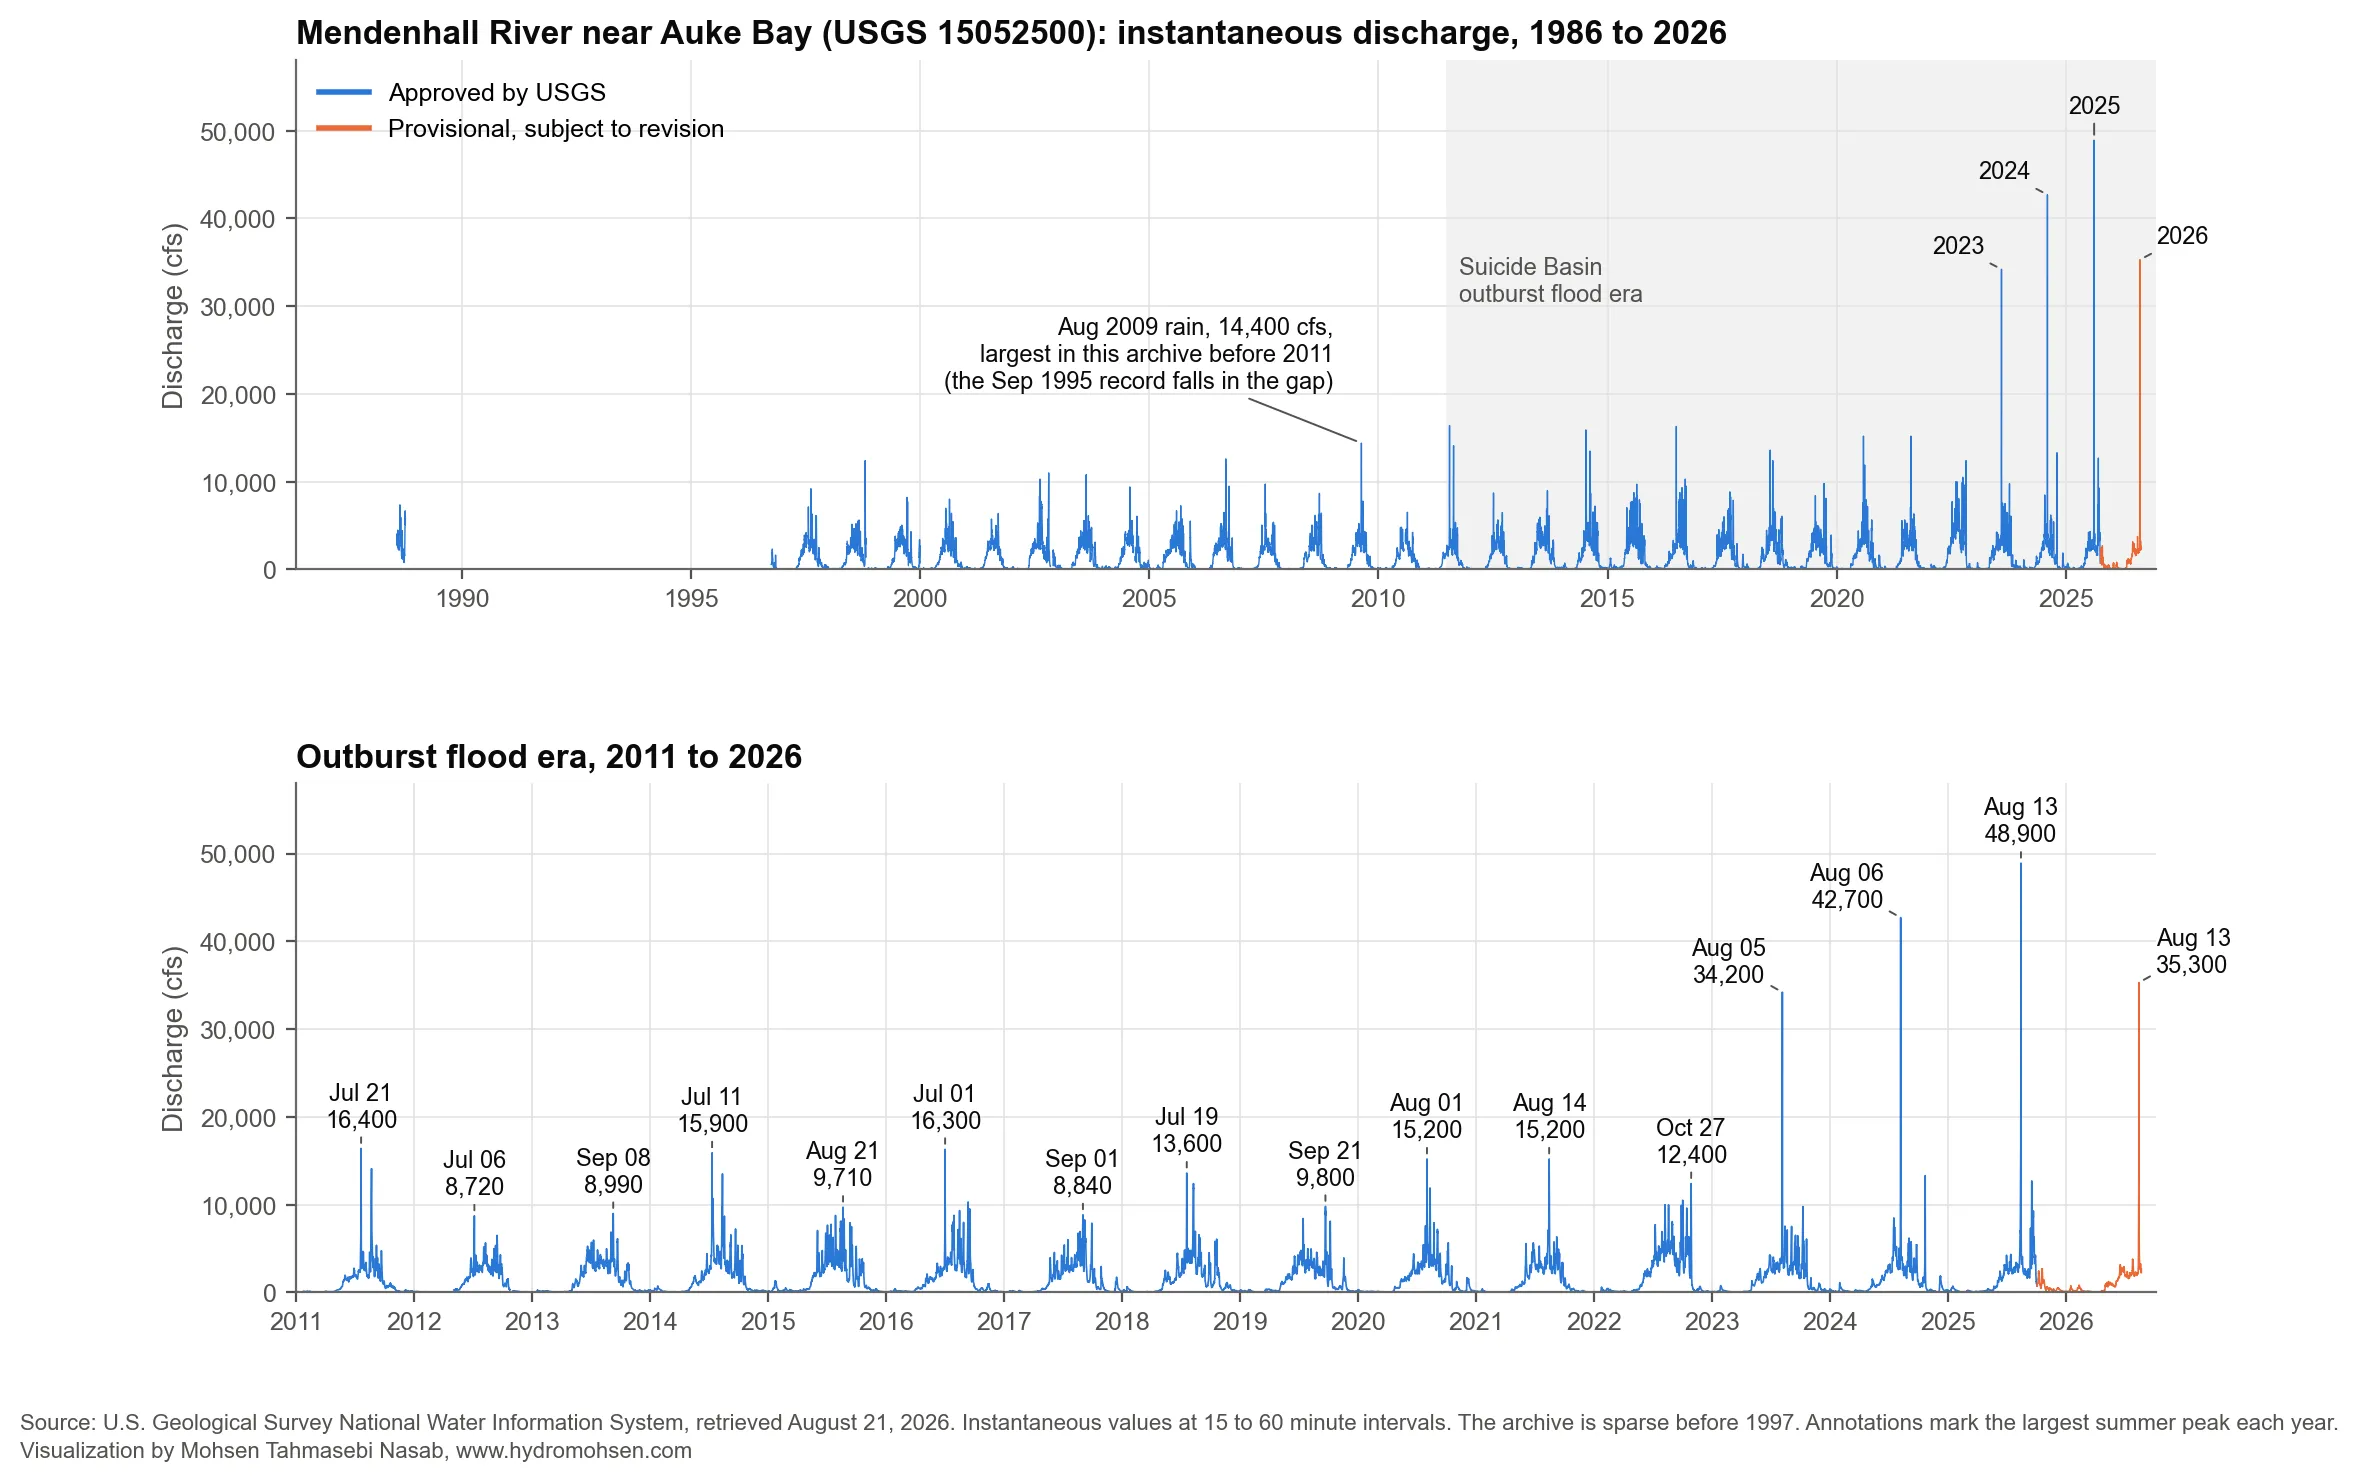
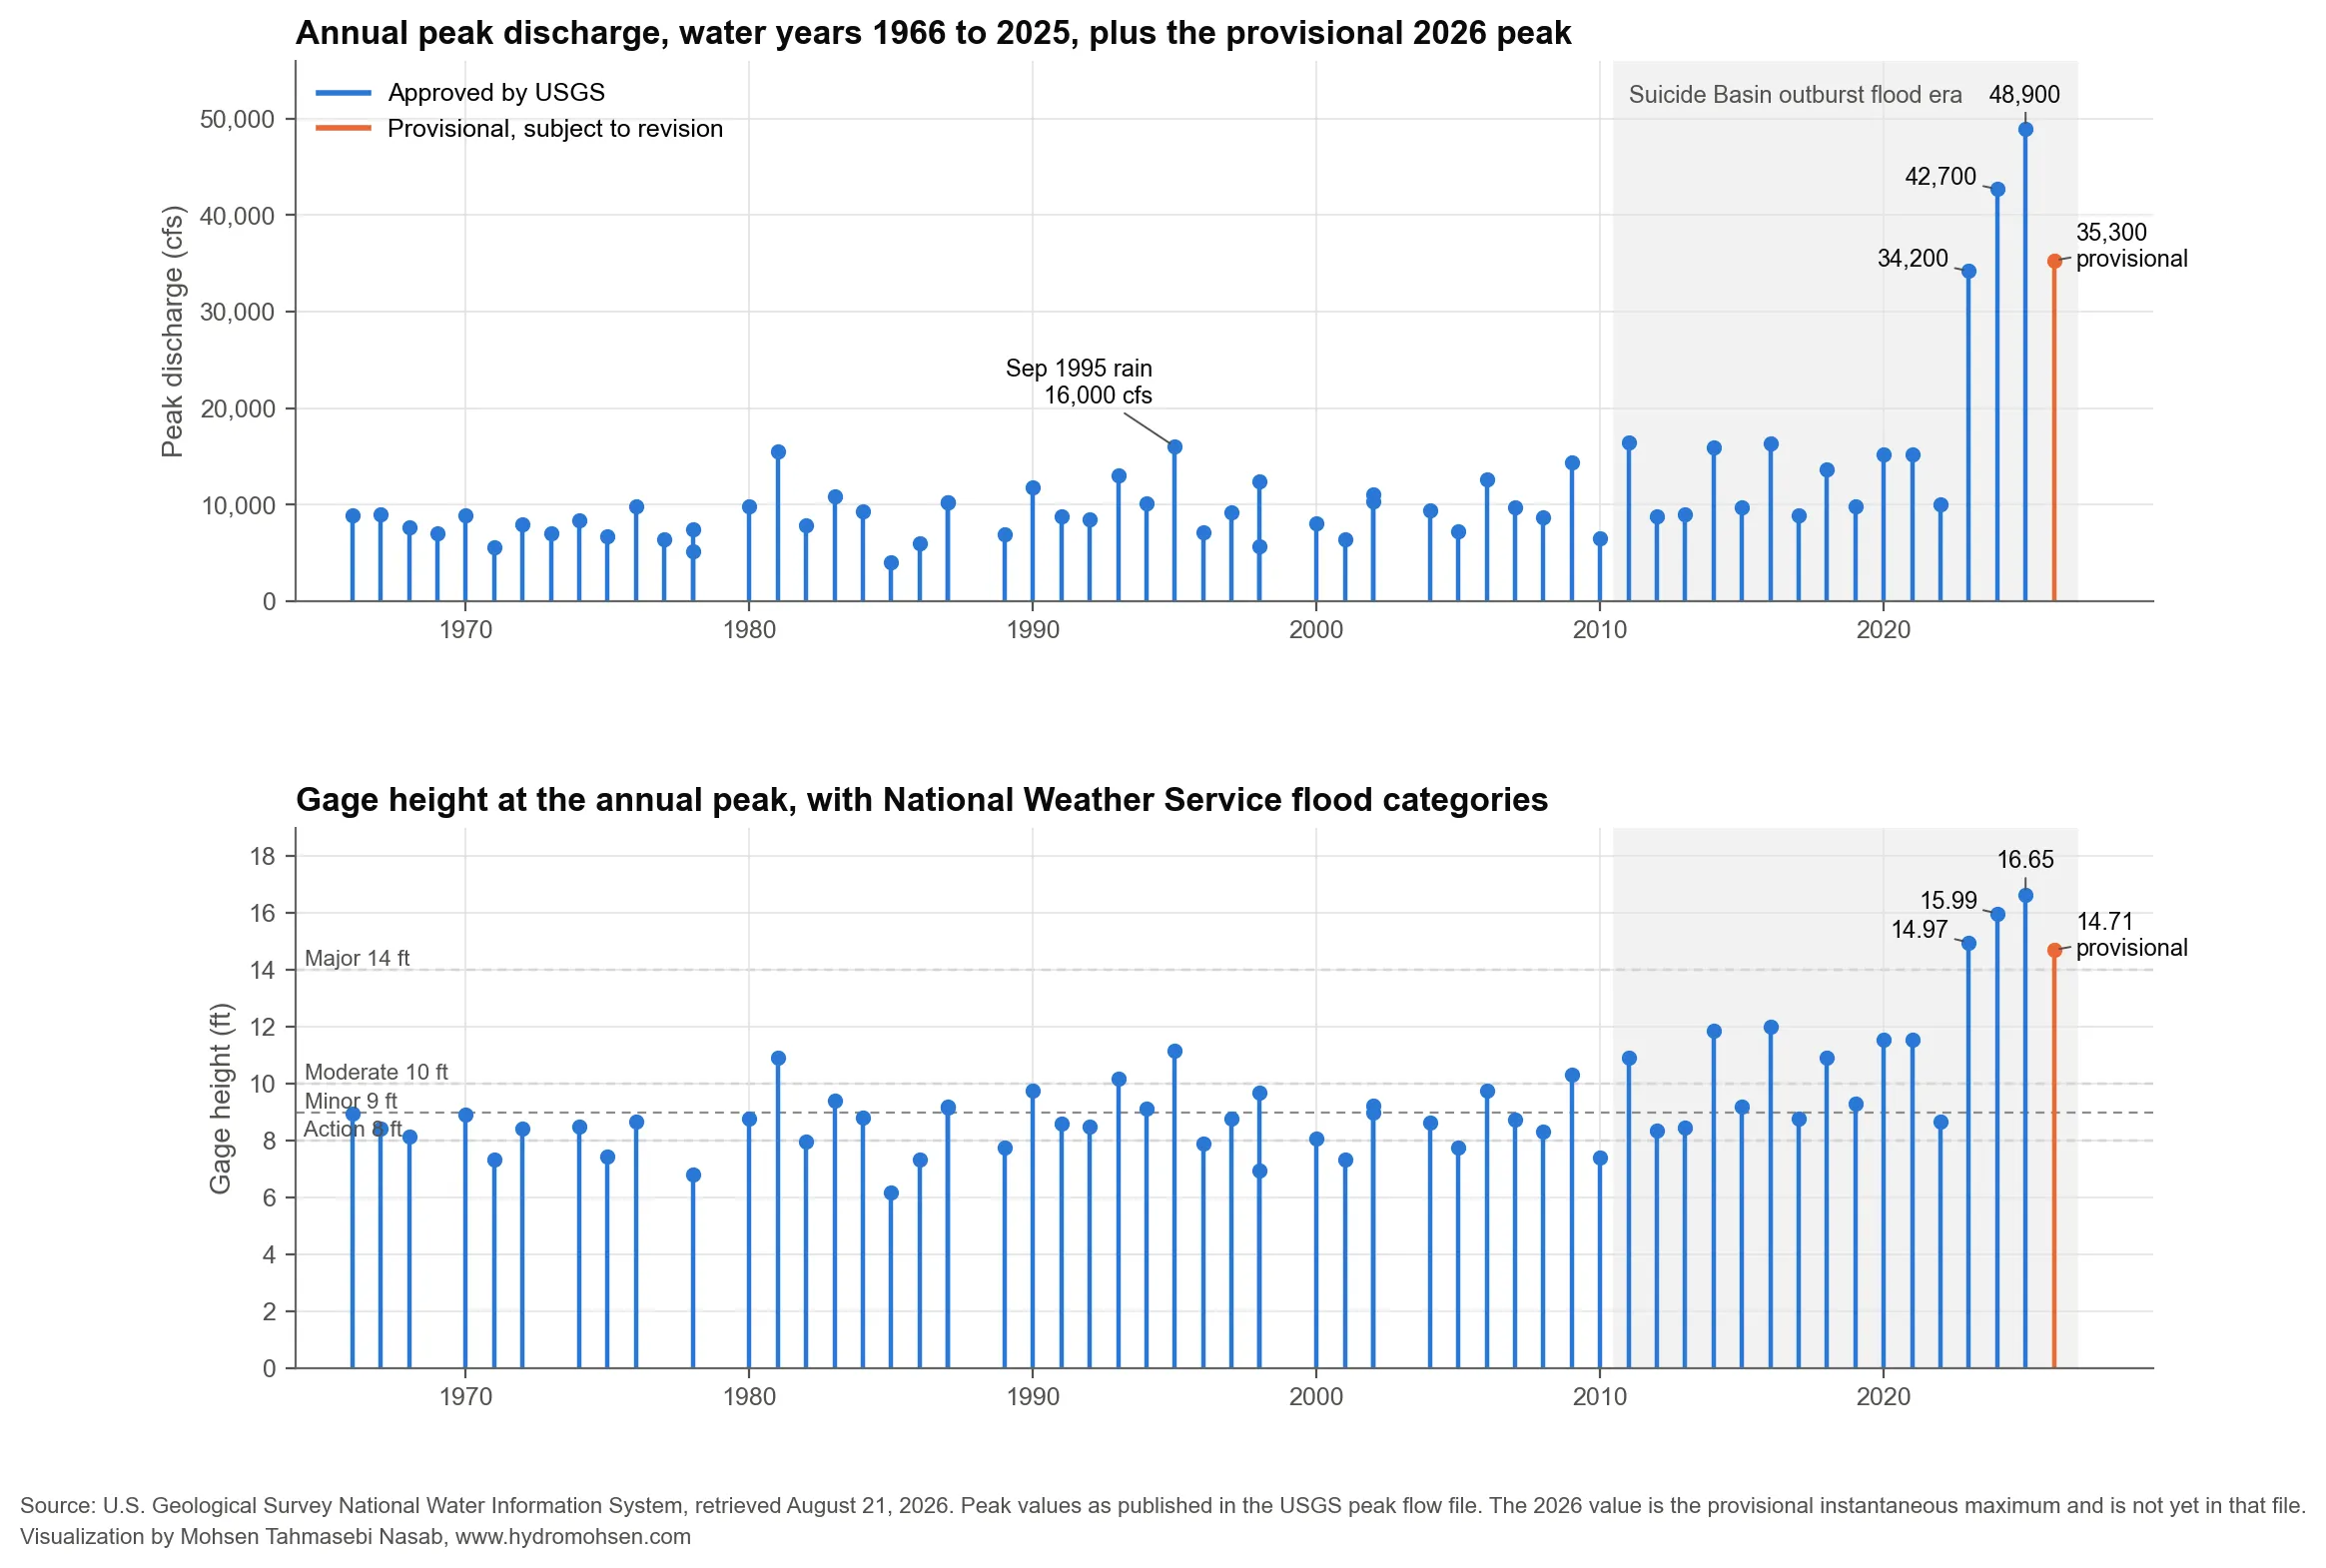
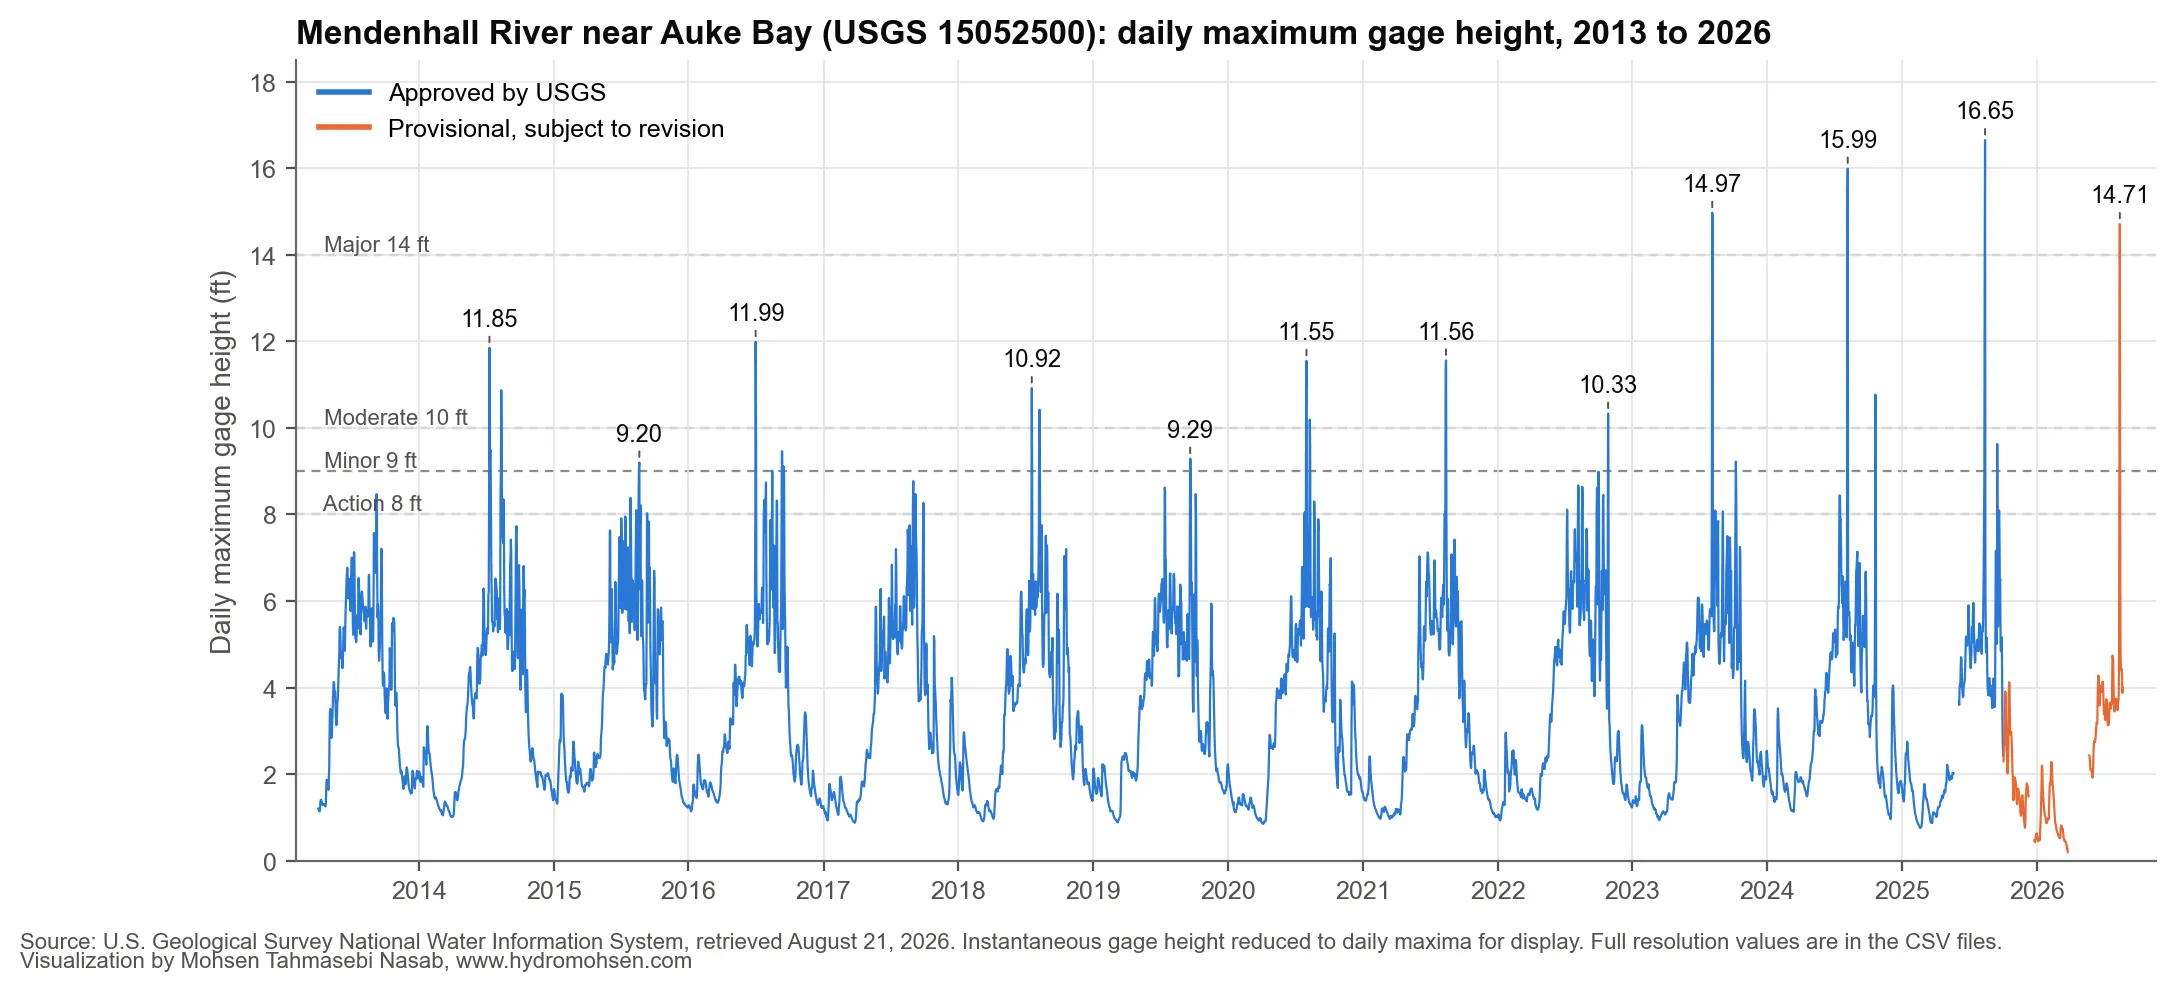
Figure 2 shifts from the continuous record to annual peaks and adds the National Weather Service flood categories: action stage at 8 feet, minor flood at 9 feet, moderate flood at 10 feet, and major flood at 14 feet (NWS gauge reference). Every annual maximum from 2023 through 2026 exceeded major flood stage. Before 2011, no annual maximum in the published record had reached it.
How Suicide Basin creates a GLOF
Suicide Basin is roughly 0.7 square kilometers (about 0.27 square miles) and lies about 3 kilometers (about 1.86 miles) upglacier from the Mendenhall Glacier terminus. Ice from the main glacier crosses the basin mouth and acts as a temporary dam. The result is not a fixed lake behind a fixed concrete wall. It is a changing hydraulic system made of moving ice, rock, water, and sediment, and it has released GLOFs annually since 2011. Kienholz et al. document the setting and its rapid evolution.
As the basin fills, the water gains hydraulic head, meaning the pressure and elevation energy available to drive water downhill. A drainage connection can develop below the glacier. Scientists call this an inferred subglacial conduit, not a known pipe, because it is hidden by ice and changes as the event unfolds. Flow through a small passage produces heat, which melts and enlarges the passage. A larger passage carries more water and can generate more melt. That feedback explains why a GLOF often begins gradually and then accelerates sharply, a pattern Abdel-Fattah and colleagues describe as a slow start followed by a rapid, exponential rise in discharge once the connection is established. Ice deformation works in the other direction by squeezing the passage toward closure. The competition between opening and closure shapes the flood hydrograph.
Water can also overflow supraglacially, meaning across the surface of the ice dam, before the main subglacial release begins. Kienholz and colleagues observed exactly that in 2019. That observation is one reason the local research team does not treat ice flotation at one fixed lake level as the sole trigger. Past floods have begun early, after overflow, or with interrupted drainage. The more defensible explanation is that drainage begins when the lake connects to an evolving pathway below the ice.
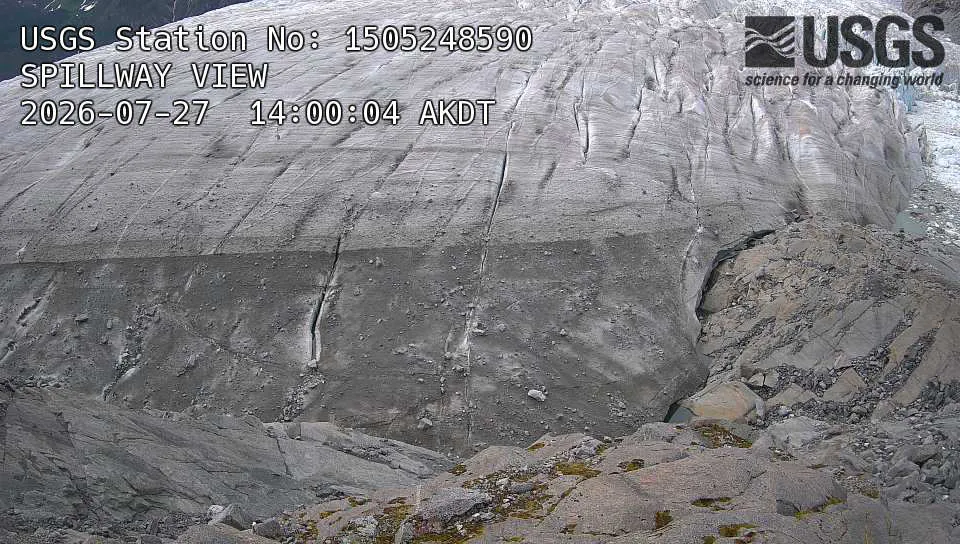
There is one more long-term wrinkle. As the ice dam thins year by year, the basin cannot hold water to the elevations it once did. The federal record shows a basin pool near 1,445 feet in 2016, while the 2023 through 2025 events began their releases from starting pools between about 1,363 and 1,387 feet. A thinning dam stores less head even as the basin itself keeps evolving.
Two gauges, two parts of the flood
The two USGS stations answer different questions.
USGS-15052500, Mendenhall R NR Auke Bay AK, measures downstream river stage and discharge. Its stage is referenced to a local gage datum. It is neither river depth nor a number that can be compared directly with Suicide Basin's reservoir-elevation reading. USGS derives discharge from continuous stage observations and field measurements using a stage-discharge rating curve. Floods can alter the channel and therefore the curve, which is why streamflow values can be revised. See the USGS explanation of streamflow measurement and rating curves.
USGS-1505248590, Glacial Lake 2.5 MI N of Nugget C NR Auke Bay AK, reports parameter 00062, elevation of reservoir water surface above datum, feet. It measures water level in the basin. It does not directly measure how many cubic feet or cubic meters of water are stored there. The quantity needed for storage is an elevation-volume relation, often called basin hypsometry. That relation must be built from a current map of the basin and ice geometry.
USGS uses approved status after its review and processing are complete. Provisional status means the record is subject to revision. An R qualifier marks a historic value that USGS later revised. A value is not less useful because it is provisional, but it should not be presented as final. In particular, the 2026 river peak remains provisional. The available 2024 to 2026 Suicide Basin elevation records also remain provisional. USGS data-status guidance explains the distinction. The numbered plots keep it visible: approved values are blue and provisional values are orange. Figure 3 shows where that status changes across the continuous river-stage record.
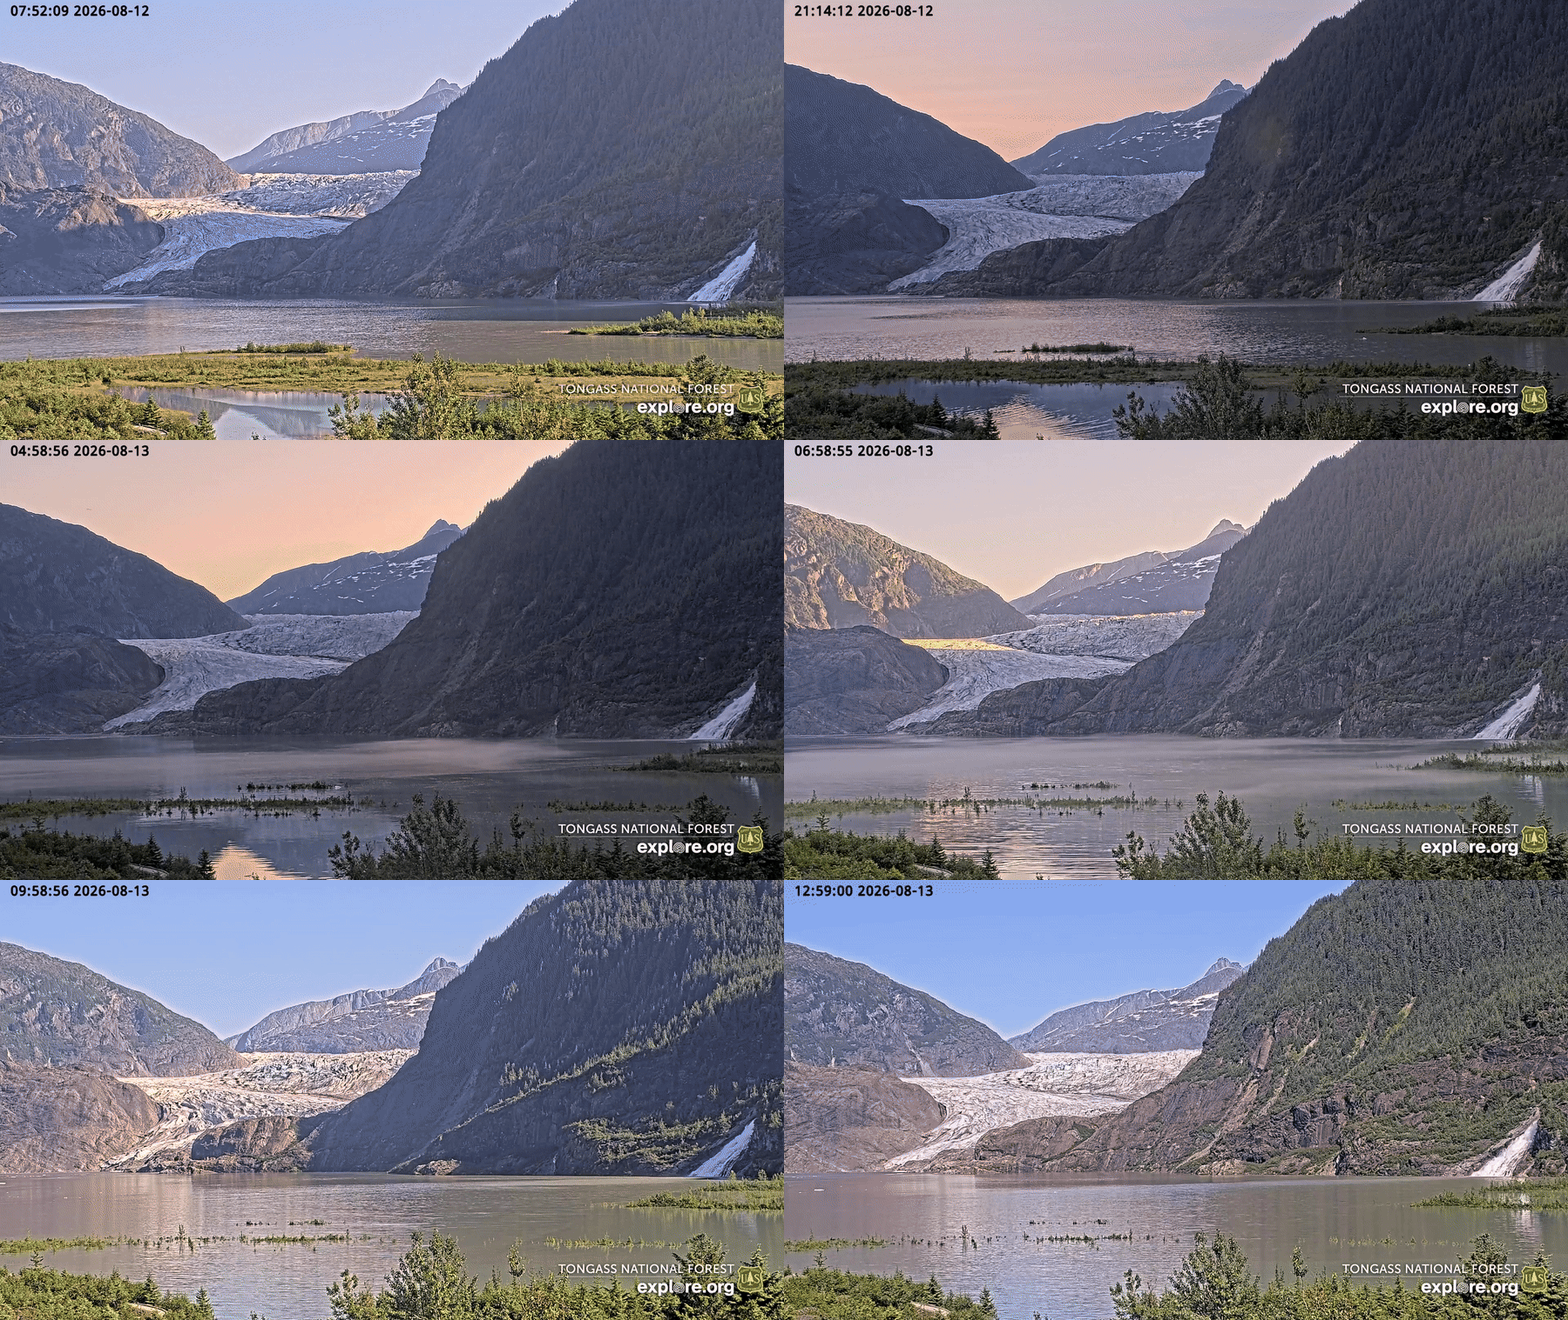
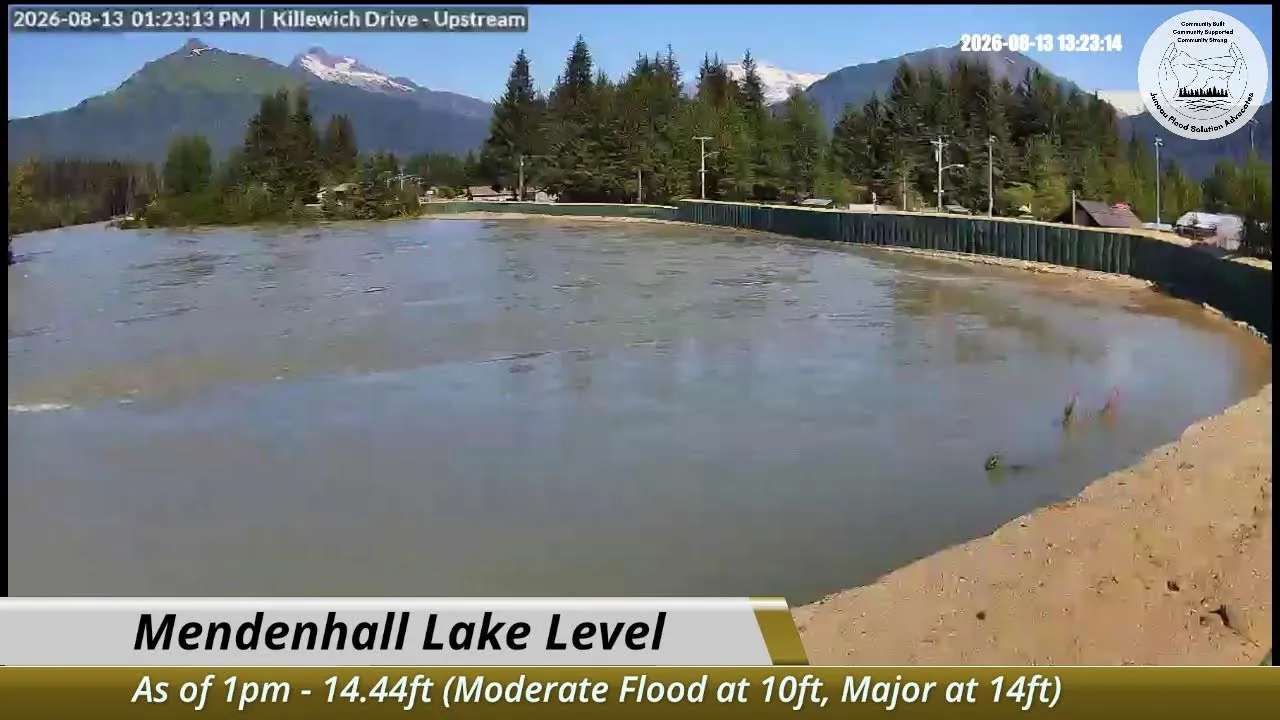
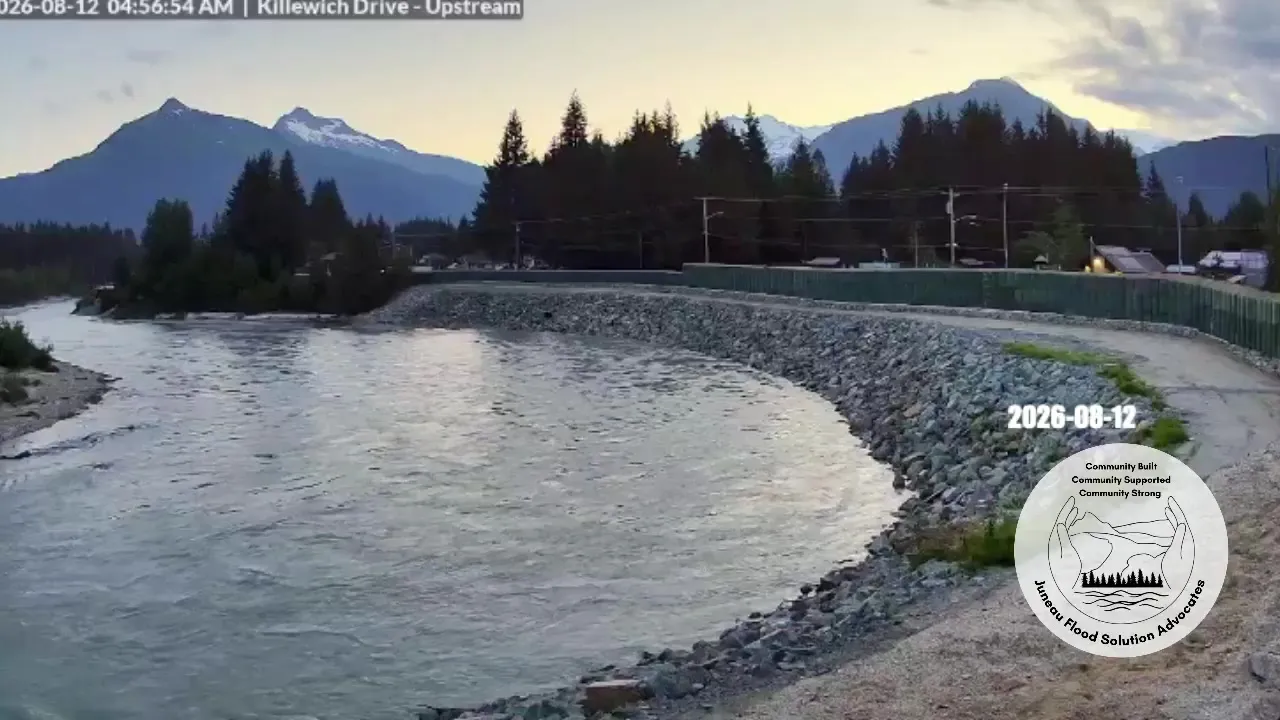
What the gauge records as a rising number, a camera on the lakeshore records as a disappearing shoreline. The river gauge sits at the outlet of Mendenhall Lake, so the lake is the first place the basin release shows up downstream.
The 2023 to 2026 record
The table below uses the maximum instantaneous USGS river values in an August 1 to 20 event window. Times are Alaska daylight time. The 2026 numbers are shown exactly as provisional. The 2023 discharge carries an approved, revised qualifier in the USGS record.
| Year | Peak river stage | Peak discharge | USGS status at retrieval |
|---|---|---|---|
| 2023 | 14.97 ft, Aug. 5 at 11:15 p.m. | 34,200 cfs, Aug. 5 at 11:15 p.m. | Approved, with revised discharge qualifier |
| 2024 | 15.99 ft, Aug. 6 at 3:15 a.m. | 42,700 cfs, Aug. 6 at 3:15 a.m. | Approved |
| 2025 | 16.65 ft, Aug. 13 at 7:15 a.m. | 48,900 cfs, Aug. 13 at 7:15 a.m. | Approved |
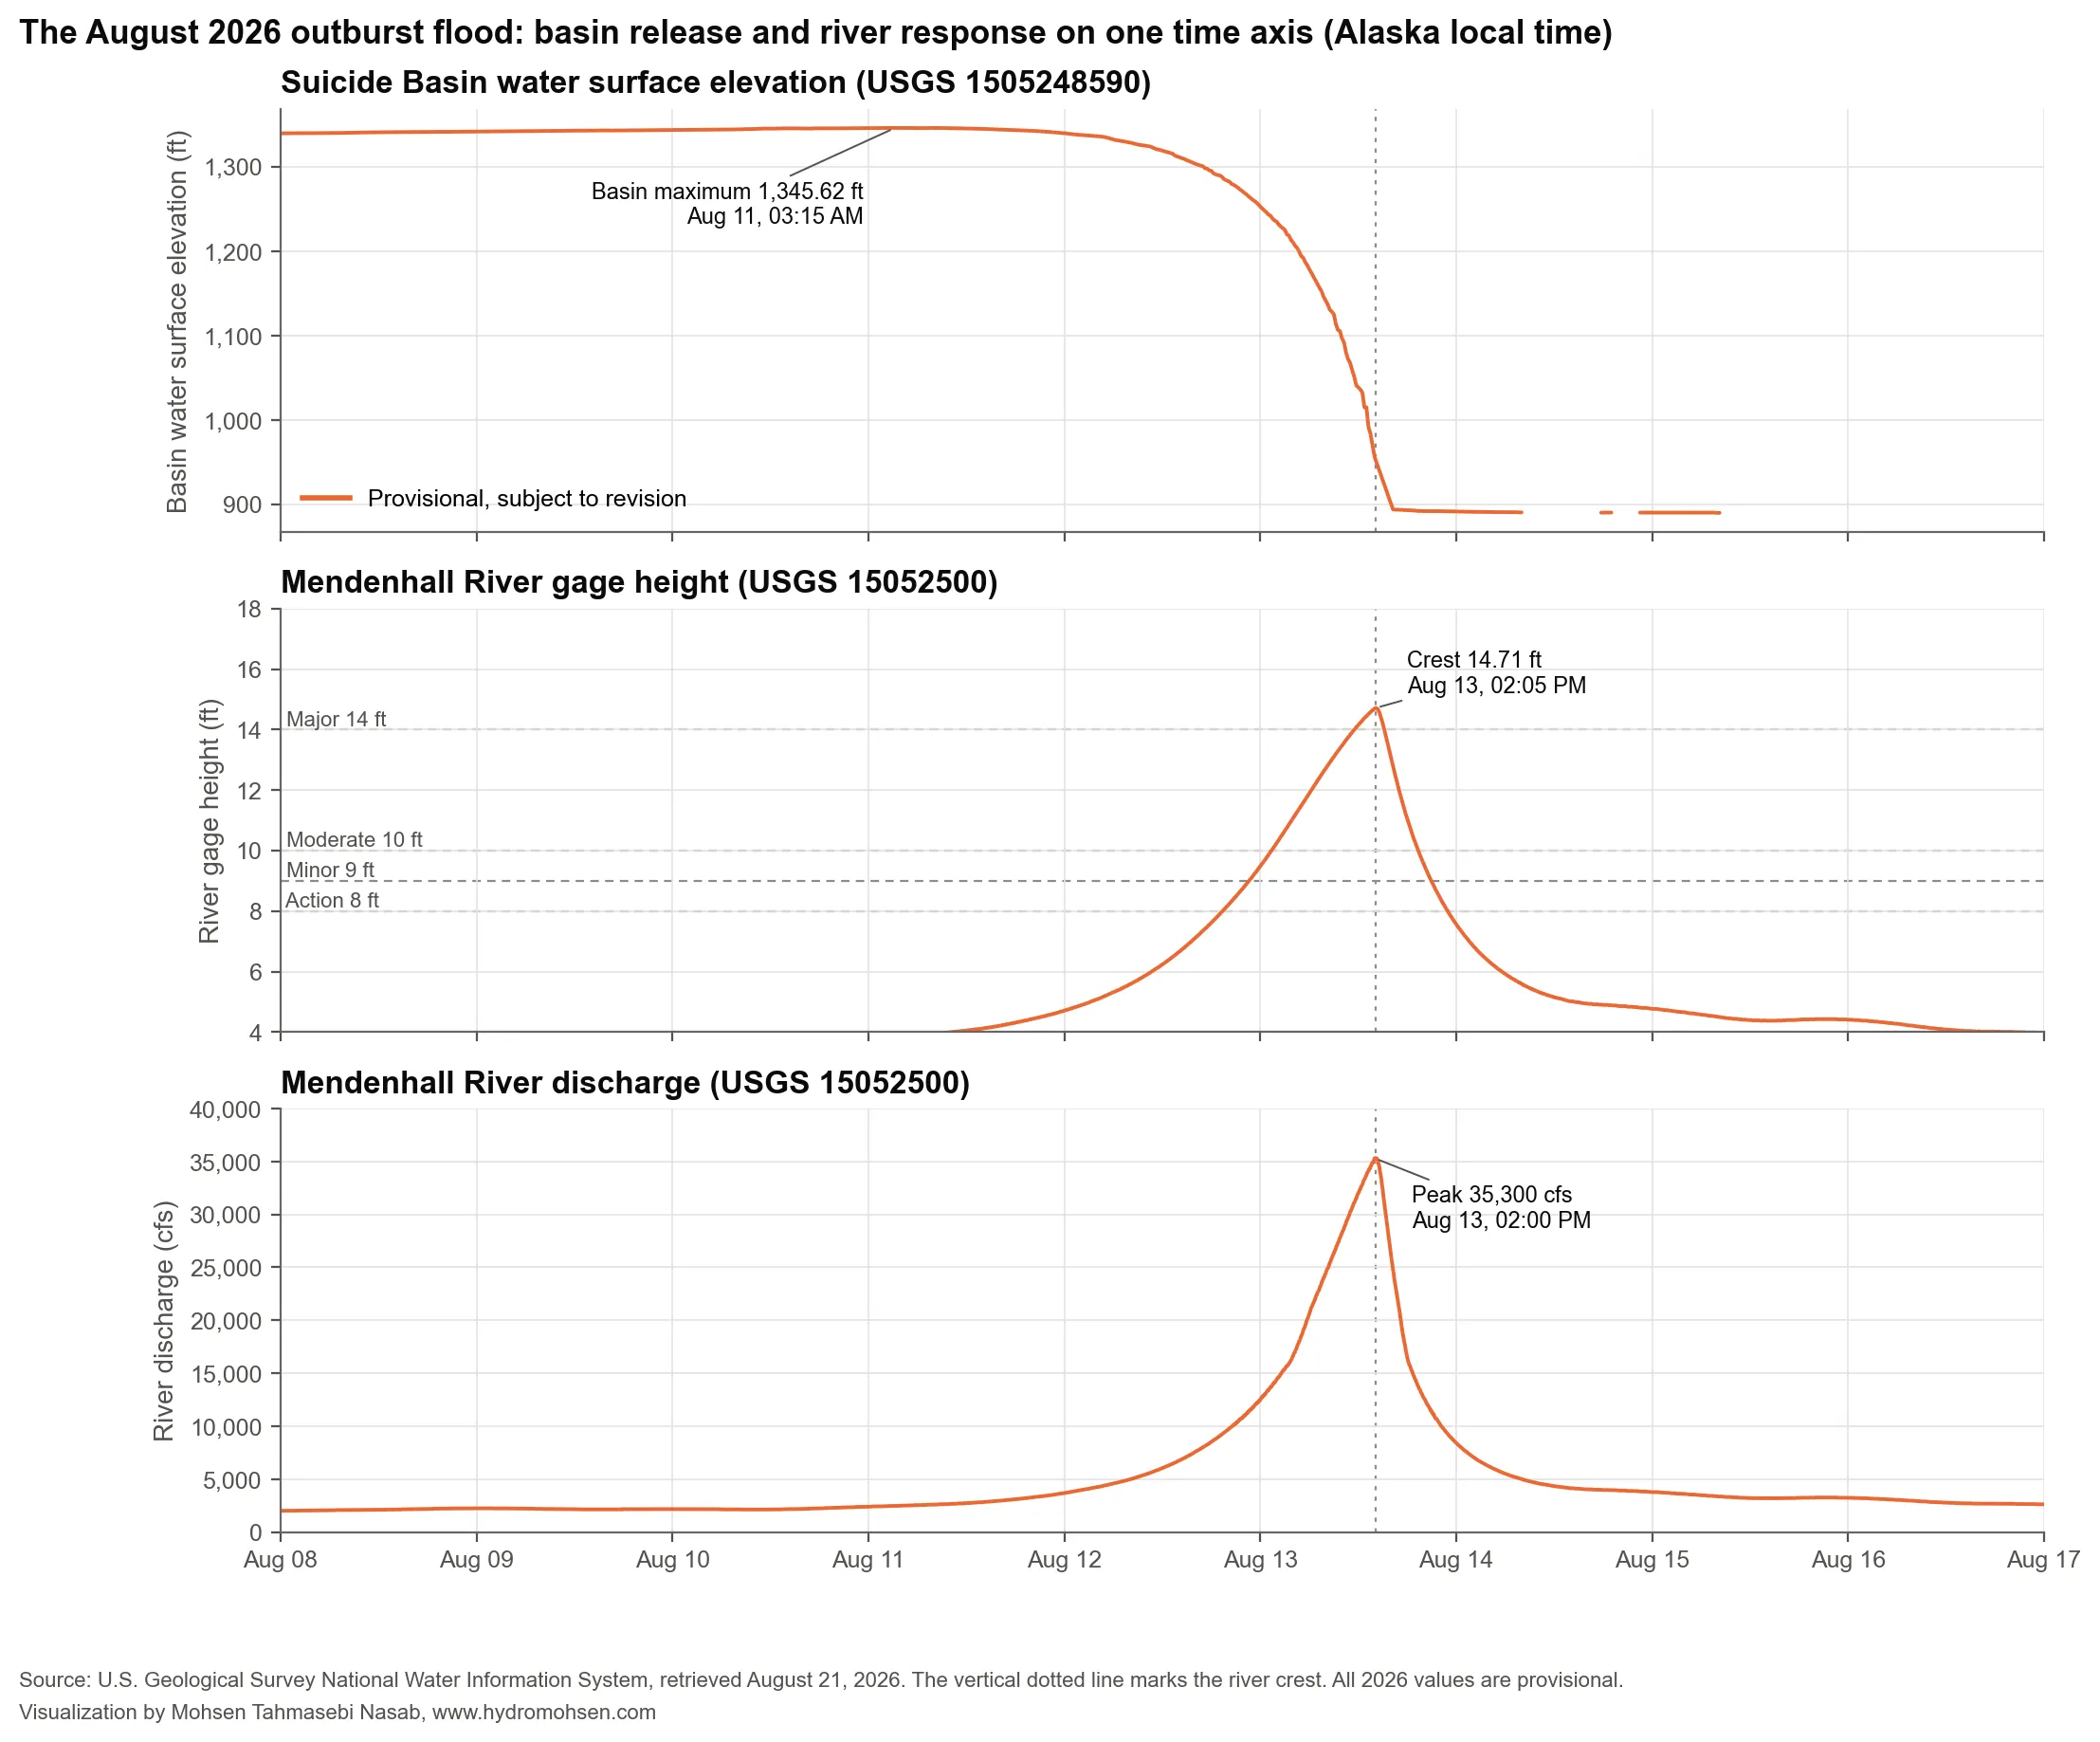
| 2026 | 14.71 ft, Aug. 13 at 2:05 p.m. | 35,300 cfs, Aug. 13 at 2:00 p.m. | Provisional |
Source: USGS station 15052500 instantaneous-value records for 2023, 2024, 2025, and 2026.
Figure 4 puts the four August event windows side by side. Each has a steep final rise and a quick recession, but their lead-ins and peak sizes differ. The 2025 hydrograph, in particular, carries a longer weather-driven rise before the GLOF peak.
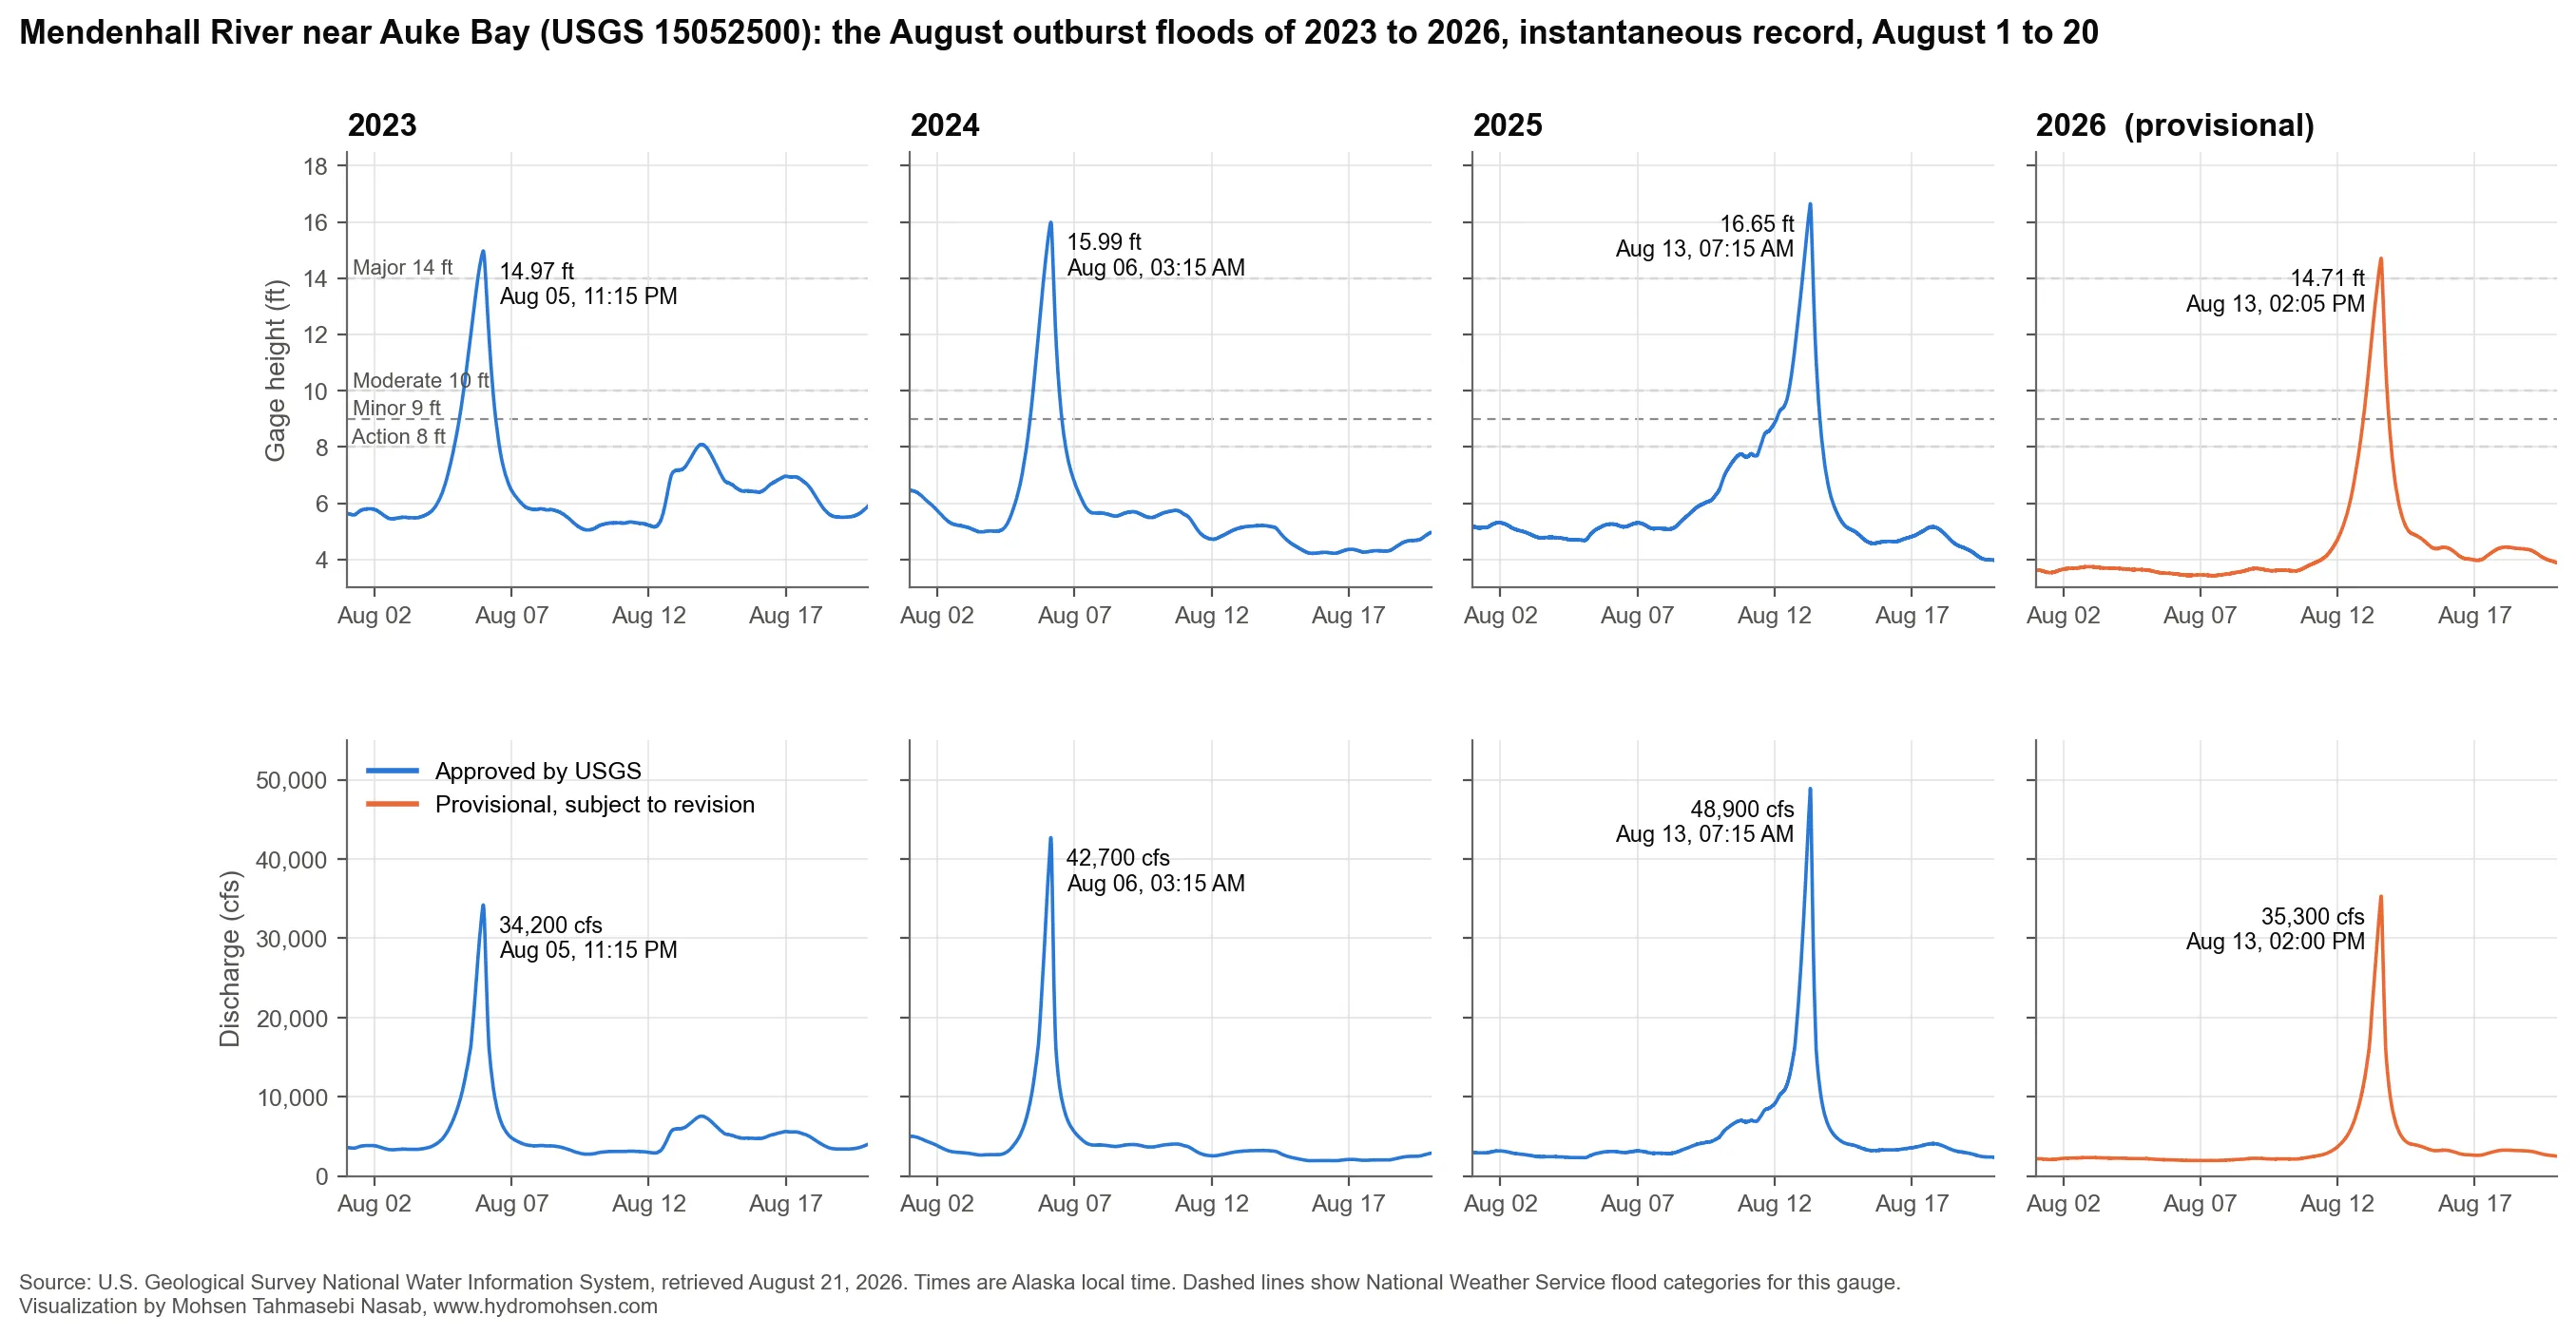
The peak numbers above mix two water sources, the basin release and whatever the weather adds. The federal reconstruction separates them. It attributes about 30,610 cfs of the 2023 peak, about 40,010 cfs of the 2024 peak, and about 43,230 cfs of the preliminary 2025 peak to the GLOF itself, with rainfall and baseflow supplying the rest. That separation matters when comparing years, because a wet August and a dry August can turn similar basin releases into very different river crests.
The sequence also shows how quickly the consequences changed. In 2023, the August 5 GLOF prompted a local emergency. The local government reported eight buildings condemned and three wastewater lift stations submerged. Its August 2023 event update records the immediate consequences. The 2024 crest rose another 1.02 feet. In 2025, the river set its current record crest. The 2026 event peaked lower, but it remained a major flood, nearly two feet above the 14-foot major flood threshold, and a reminder that a lower crest does not mean the underlying hazard is gone.
For Suicide Basin, the directly comparable raw USGS reservoir-elevation record begins in 2024. These are the highest and lowest observed values in the same August 1 to 20 window. They are water levels above the station datum, not basin volume estimates.
| Year | Highest observed basin water level | Lowest observed level in window | Status and limitation |
|---|---|---|---|
| 2023 | Comparable raw 00062 record not available | Comparable raw 00062 record not available | The current continuous record begins in 2024. |
| 2024 | 1,386.68 ft, Aug. 1 | 958.56 ft, Aug. 17 | Provisional |
| 2025 | 1,373.65 ft, Aug. 10 | 975.36 ft, Aug. 17 | Provisional |
| 2026 | 1,345.62 ft, Aug. 11 | 889.76 ft, Aug. 15 | Provisional |
Source: USGS station 1505248590 parameter 00062 records for 2024, 2025, and 2026.
Figure 5 shows the other half of the system. The basin water surface climbs for months, then drops hundreds of feet during the main release. The 2024 and 2025 records also show a smaller refill and second release in early autumn; the basin does not stay empty once the main flood is over.
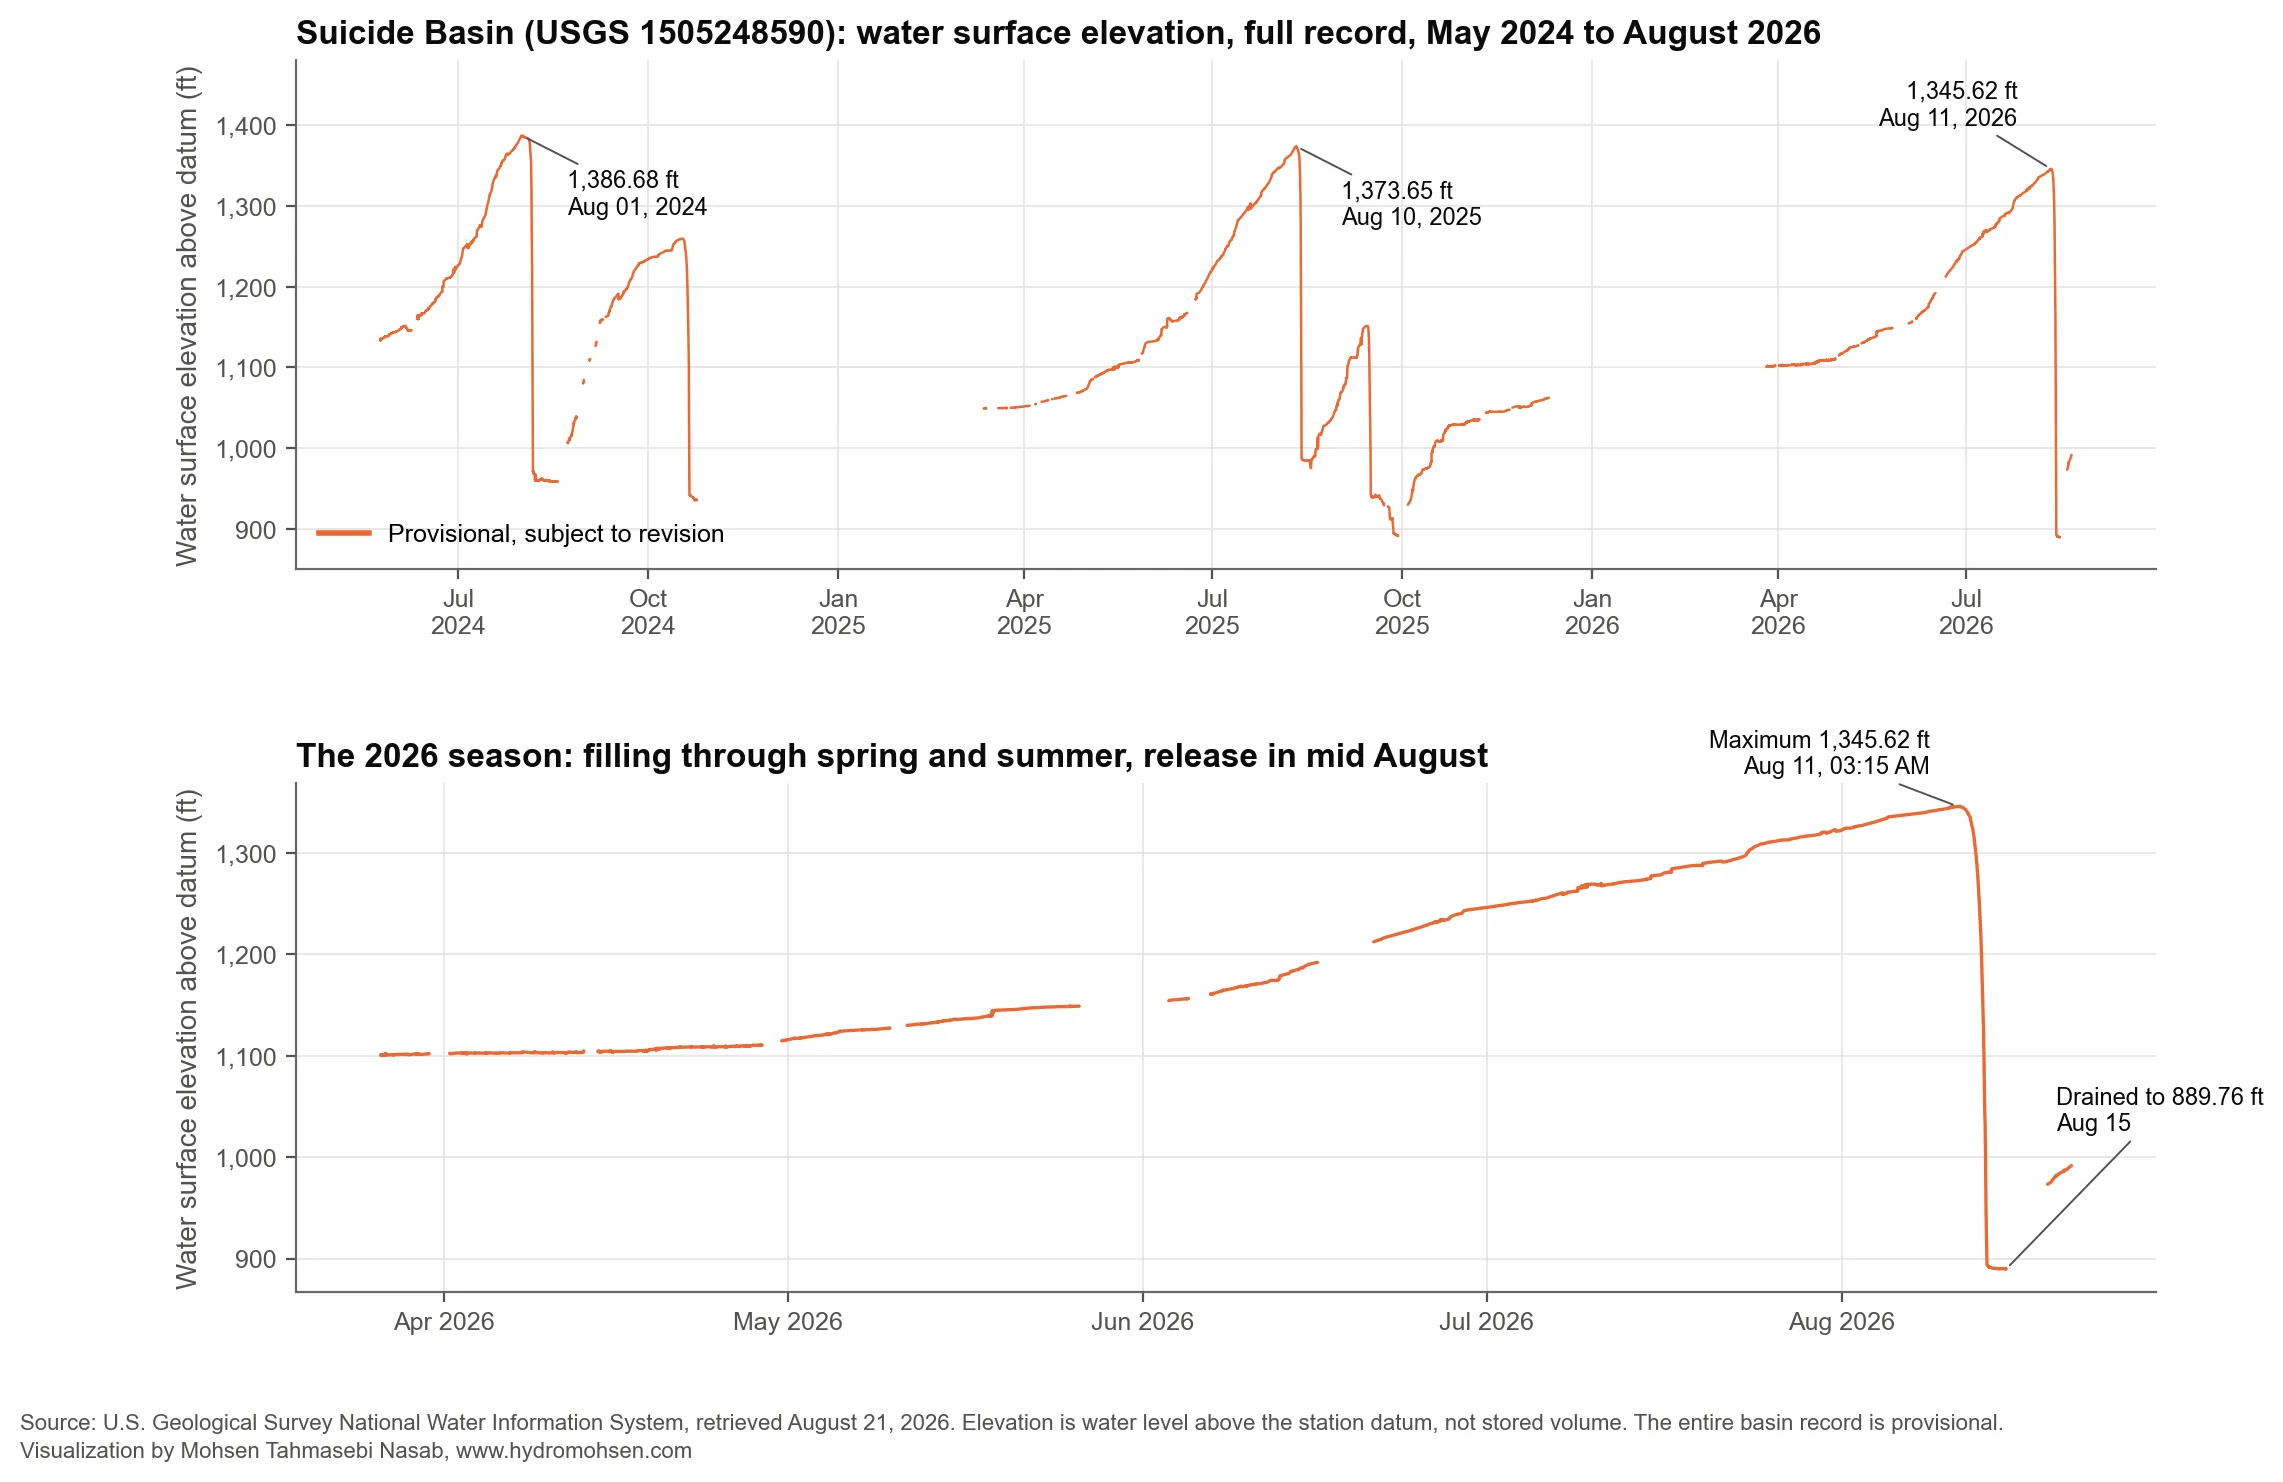
There is useful 2023 basin context, but it is a different kind of evidence. The National Weather Service retrospective reconstruction lists a starting basin level of 1,387 feet, an ending level below 951 feet, and an estimated 98 percent release. That analysis combines gauges with drone imagery and an elevation-volume model built on the August 6, 2024 DEM. It is valuable reconstruction work, but it should not be mixed with the direct 2024 to 2026 station series as if they were identical measurements. The 2025 post-event report documents the method. The same table lists the 2024 release at 111 percent of estimated storage, an impossible figure taken literally and an honest illustration of how much uncertainty sits inside any basin-volume estimate.
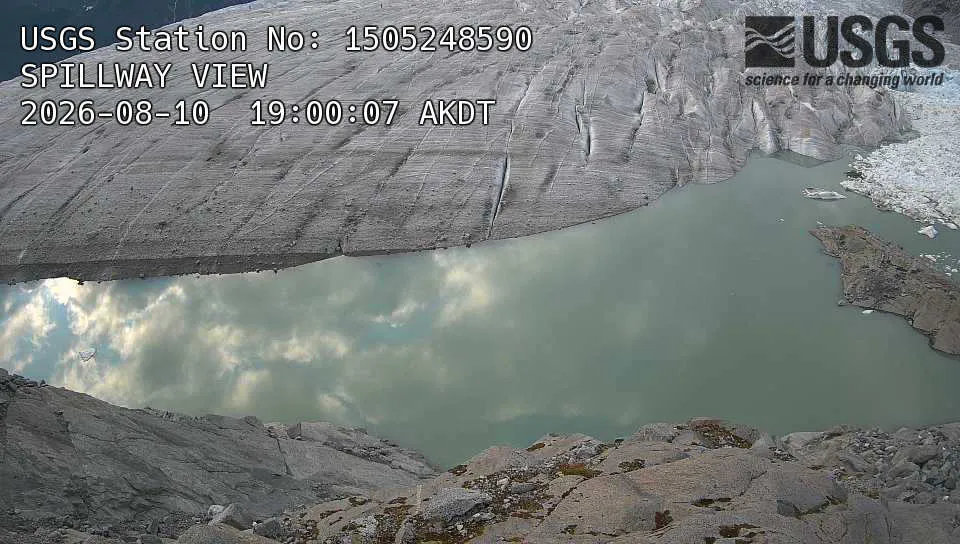
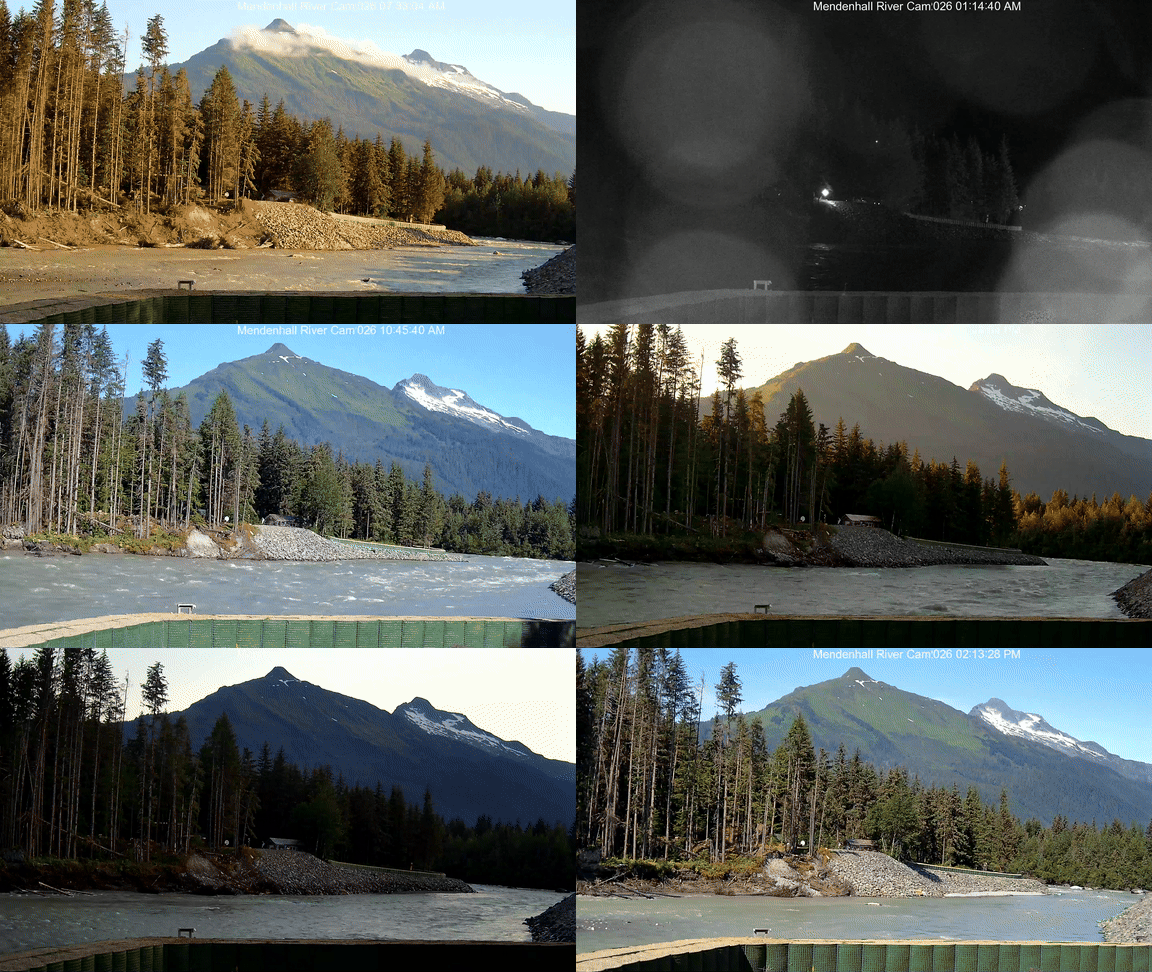
A fixed camera on the riverbank turns those tables into something you can watch. The fixed view makes the rise and recession easy to follow even as light and weather change.
Reading the lower 2026 crest
The 2026 crest came in below the forecast. The observations provide useful context, but they do not support a complete physical explanation on their own.
| Indicator | 2025 | 2026 | How to interpret it |
|---|---|---|---|
| Highest raw Suicide Basin water level | 1,373.65 ft, provisional | 1,345.62 ft, provisional | The 2026 high reading was 28.03 feet lower, though a level difference is not a volume difference. |
| Mendenhall River discharge at 8:00 a.m., Aug. 11 | 6,890 cfs, approved | 2,590 cfs, provisional | The 2026 river began with less than half the background flow. |
| Weather contribution | Atmospheric river, about 5.5 inches of valley rain to nearly 8 inches at Suicide Basin | Warm and dry under persistent high pressure | 2025 rainfall added substantially to the downstream flood. |
| Observed river crest | 16.65 ft, approved | 14.71 ft, provisional | The 2026 crest was 1.94 feet lower. |
The 2025 post-event analysis attributes the record flood to both high GLOF drainage and heavy rainfall. The rain event displayed the signature of an atmospheric river, lasted more than 72 hours, lifted the freezing level above 11,000 feet, and raised river baseflow before the basin release. The storm total was the highest 7-day precipitation on record for that window at the Juneau forecast office. The 2026 forecast discussion instead described warm, dry conditions under stationary high pressure. The river therefore entered the 2026 release at a lower flow, without a concurrent rain pulse. The lower basin reading shows a lower water-surface elevation, but without a current elevation-volume relation it does not, by itself, tell us how much less water was stored. These measurements describe the different starting conditions; they do not partition the causes of the lower crest. The 2025 report and the 2026 forecast discussion support that comparison.
Figure 6 puts the basin and river gauges on the same clock. The basin began to fall slowly late on August 11, and the drawdown accelerated through August 12 and 13. At the first 14.71-foot river reading, the basin was still in the steep final part of its drawdown: 956.11 feet at 2:00 p.m. and 949.21 feet at 2:15 p.m. It first fell below 900 feet at 4:15 p.m., just over two hours after the river crest, and continued slowly downward to the lowest reported provisional reading of 889.76 feet on August 15.
It does not explain the entire forecast difference. At 12:57 a.m. on August 12, the National Weather Service forecast a crest of 16.1 to 16.6 feet. At 9:45 a.m. on August 13, it still forecast 15.8 to 16.3 feet. Both statements were explicit that the forecast rested on an estimated basin volume and release rates drawn from previous events, and that partial versus full drainage is a major source of uncertainty. By 3:06 p.m. that day, the service reported the release was ending and the river had crested around 14.7 feet. The careful conclusion is that the event did not sustain the basin-volume and release-rate combination represented by the analog forecast. A published post-event analysis has not yet assigned that difference to a specific conduit change, calving event, or ice-dam mechanism, and any confident single-cause explanation this soon would outrun the evidence. See the initial forecast, August 13 update, and observed-crest statement.
Why exact volume and peak forecasts remain hard
The first challenge is storage. A water-level gauge provides an elevation, which can be written as z. To estimate stored volume, scientists need a current relation V(z) between elevation and volume. That requires a contemporaneous DEM, a mapped waterline, and a defensible representation of the ice and basin geometry. Simple subtraction of the start and end water levels is not a volume calculation.
The difficulty is physical as well as technical. A DEM maps what is visible, not necessarily the lake bed below ice. Floating ice can flex, ground, calve, and move. Grounded ice may block part of an outlet. A thinning dam can reduce how much water is retained, while ice loss inside the basin and basin expansion can create additional storage. These competing changes mean that a lower measured water level can still be associated with a complex and uncertain stored volume. In their detailed analysis of the 2018 and 2019 events, Kienholz and colleagues estimated about 29 and 31 million cubic meters drained only after comparing pre- and post-event surveys and correcting for overflow, melt, and other changes. Their paper is a good illustration of why the calculation cannot be reduced to one gauge difference. The 111 percent release figure in the federal 2024 reconstruction makes the same point from the operational side.
The second challenge is release behavior. An inferred conduit can open early, drain only part of the basin, speed up, slow down, shift, or close. For most of the record since 2011 partial drainage was the norm, and the recent run of essentially full releases is itself a change in behavior. Those variations alter both the timing and the shape of the GLOF hydrograph. The downstream river then adds a second layer of complexity because the GLOF signal is combined with rainfall, snowmelt, glacier melt, tributary inflow, and temporary storage in Mendenhall Lake. The river gauge measures the combined result, not a direct flow meter at the hidden basin outlet.
The third challenge is data timing. Basin geometry is surveyed at intervals, weather varies sharply between the valley and high glacier terrain, and telemetry can be interrupted during the event. Operational forecasts therefore use the best available water-level estimate and earlier floods as analogs. They are indispensable for warning and preparation, but their uncertainty is part of the science, not a failure to take the hazard seriously. The 2026 forecast stated that uncertainty clearly; the difference between the forecast and the observed crest shows how much the event-specific release behavior still matters.
How the valley is reducing risk
Juneau's flood strategy is layered. It combines monitoring, early warning, temporary physical defenses, drainage management, evacuation and access planning, flood mapping, and study of longer-term risk reduction. The shared work of residents, municipal staff, and local, state, federal, Tribal, and university partners has made the valley more prepared after a sequence of difficult floods.
| Risk-reduction layer | How it works | Limitation to keep in view |
|---|---|---|
| Temporary barriers | Wire-mesh, geotextile-lined cells filled with soil or sand act as rapidly constructed temporary levees. | They reduce overbank flooding along a protected alignment. They do not stop the GLOF at its source. |
| Bank armoring and berms | Armoring reduces scour that could undermine a barrier. A berm blocks a defined overtopping route. | They protect particular reaches and pathways, not the entire floodplain. |
| Drainage management | Check valves limit river water backing up through storm drains. Pumps manage seepage and water on the protected side. | Pumps and valves cannot remove all flood risk or protect every individual property. |
| Forecasting and inundation maps | Gauges, cameras, weather data, hydraulic modeling, alerts, and closures support decisions before and during an event. | Maps are scenario tools, not a guarantee of a specific flood depth or flood edge. |
The barrier program has moved fast by infrastructure standards. A first-generation temporary levee of about 2.5 miles went in along the riverbank before the 2025 melt season, and it was credited with holding back the record 2025 crest well enough to prevent a repeat of the 2024 neighborhood flooding (federal account). Ahead of the 2026 season the system was rebuilt using damage observations from 2025 and updated hydrologic and hydraulic modeling, with a stated design capacity of 63,500 cfs, described locally as roughly an 18-foot stage event (completion notice, July 2026). Separate federal emergency work under Public Law 84-99 added 2.72 miles of temporary gabion-style barriers, 1.85 miles of riverbank armoring, and a 1,100-foot earthen berm (federal Phase 2 release). These are meaningful interim defenses. They are not permanent or fail-safe protection.
The municipal inundation maps are also more useful when read with their limits. They cover 8-foot through 20-foot lake stage scenarios, were produced through hydrologic and hydraulic modeling by an engineering consultant with review by federal agencies and the state university, and were calibrated to confirmed high-water marks from the 2024 flood. They show predicted flood extent rather than depth, and the barriers appear only on the 14 through 18 foot maps because the barrier design height was set from 2024 event data. The flood-map page and its FAQ spell out the assumptions, which is exactly why the maps should guide preparation rather than be treated as a promise.
Four consecutive major floods make clear how much the river's recent behavior differs from the earlier record. In fifteen years, Juneau has built a real-time monitoring and forecasting system and temporary defenses around a hazard that had not appeared at the river gage before 2011. Those measures reduce risk; they do not remove it. Continued monitoring, review of each new record, barrier maintenance, and longer-term study remain necessary.
Sources and data method
- Kienholz, C., and colleagues, 2020. Deglacierization of a Marginal Basin and Implications for Outburst Floods, Mendenhall Glacier, Alaska, Frontiers in Earth Science, 8, 137. Primary academic source for Suicide Basin geometry, ice-dam evolution, drainage mechanisms, and the 2018 and 2019 volume estimates.
- Abdel-Fattah, D., and colleagues, 2021. User Engagement in Developing Use-Inspired Glacial Lake Outburst Flood Decision Support Tools in Juneau and the Kenai Peninsula, Alaska, Frontiers in Earth Science, 9. Academic source for GLOF hydrograph behavior and Juneau decision-support context.
- U.S. Geological Survey, station 15052500. Mendenhall R NR Auke Bay AK monitoring page. The river table reports the maximum instantaneous values in the linked August 1 to 20 raw queries. Parameter 00065 is stage and parameter 00060 is discharge.
- U.S. Geological Survey, station 1505248590. Glacial Lake 2.5 MI N of Nugget C NR Auke Bay AK monitoring page. The basin table uses parameter 00062, reservoir-water-surface elevation above datum. The comparable continuous series begins in 2024.
- U.S. Geological Survey. Provisional-data statement, why streamflow values are revised, streamflow measurement overview, and rating-curve explanation. Sources for data-status and measurement terminology.
- National Weather Service. August 2025 Mendenhall River Flooding Summary. Federal post-event report for the pre-2011 baseline, the release count, rainfall, baseflow, GLOF-only flow reconstruction, volume-method caveats, and the historical basin-pool elevations. Its 51,000 cfs 2025 figure was preliminary. This post uses the current approved USGS 2025 peak of 48,900 cfs.
- National Weather Service. Mendenhall River near Auke Bay gauge and flood categories. Archived NWS Juneau text products, preserved by the Iowa Environmental Mesonet: initial forecast and uncertainty statement, August 13 forecast update, release-end and crest statement, and warm, dry forecast discussion.
- City and Borough of Juneau. August 2023 flood-event update, flood-inundation maps and FAQ, and Phase 1 barrier completion notice.
- U.S. Army Corps of Engineers. Phase 2 mitigation completion release, and 2025 barrier performance account.
- Congressional Research Service, 2025. Glacial Lake Outburst Floods: Mendenhall Glacier Case Study and Issues for Congress. Federal policy-level overview of the Mendenhall GLOF problem.
- Alaska Division of Geological and Geophysical Surveys. Glacier-change hazard monitoring. State source for real-time monitoring of ice-dammed lakes at four Alaska sites, including Suicide Basin.
- Numbered data figures. The six static figures were drawn from USGS records downloaded on August 21, 2026. Their interactive companions use a checked, reproducible USGS snapshot retrieved on September 5, 2026. Approved values are blue and provisional values are orange throughout. Long series are reduced with a peak-preserving display sample; the source queries and build script are kept with the site so the figures can be updated after USGS finishes reviewing the 2026 record.
Mohsen :)