Built for Python 3.8+. Contributions are welcome, and accepted ones are credited. Start with the video below, then work through the modules in order.
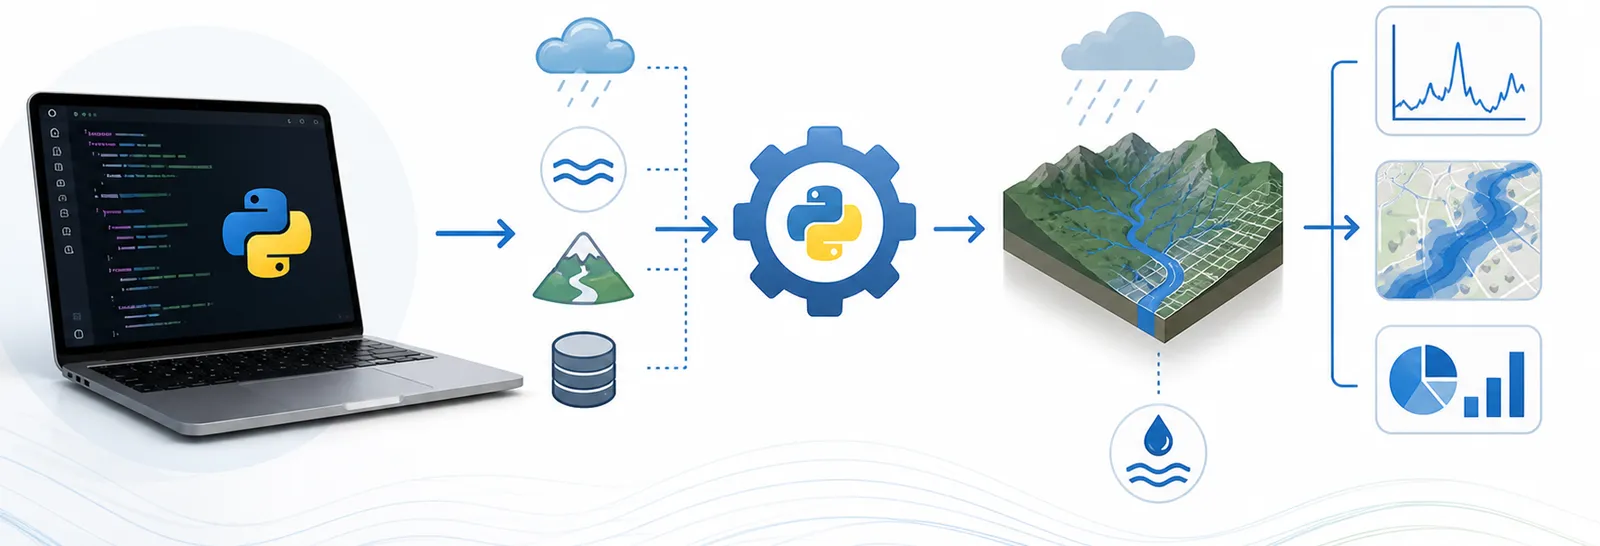
A practical Python course for water resources engineers. It teaches Python through real hydrologic and hydraulic workflows, time series, spatial data, stream gages, precipitation, instead of abstract exercises. The notebooks are built for Google Colab, so there is nothing to install to get started.
Built for Python 3.8+. Contributions are welcome, and accepted ones are credited. Start with the video below, then work through the modules in order.
A short walk-through: accessing the repository, opening the notebooks in Colab, and how the course is organized.
Every notebook is built around an actual H&H task: time series, spatial data, stream gages, precipitation grids. If it would not come up on a project, it is not in the course.
Readable, well-commented code and practical automation. The goal is work you can hand to a colleague, not a tour of advanced tricks.
Large language models are treated as a normal part of the workflow, for learning, debugging, and tightening up code, with example prompts you can reuse.
Six modules, meant to be worked through in order. Each one is a set of Colab notebooks.
Get a Python environment going (or jump straight into Colab), then the basics: variables, lists, dictionaries, loops, functions, and reading files.
Dated records the way hydrology needs them: parsing dates, resampling, filling gaps, rolling statistics, and plotting with pandas.
Points, lines, and polygons (watersheds, gages, reaches): reading shapefiles and GeoPackages with geopandas, spatial joins, and clips.
DEMs, land cover, and climate grids: reading and writing rasters, clipping to a watershed, reclassifying, and zonal summaries.
Pull years of USGS streamflow and stage data, compute flow metrics, deal with data quality, and export tidy CSV reports.
Gridded and gage precipitation (AORC, PRISM, NOAA): basin-average time series and a first look at extremes.
Once the fundamentals click, a few open-source projects are worth knowing: HyRiver for hydrology data, pysheds for terrain and flow, Pastas for groundwater time series, SPOTPY for calibration, and xarray for gridded data. For the kind of work this leads to, see the tools and apps I have built and the project work at AECOM. More videos, including recorded course lectures, are on the YouTube channel.