
I will be at two Minnesota water meetings this fall, the Minnesota Water Resources Conference in October and the Minnesota Association of Floodplain Managers conference in November, and I wanted to arrive with something Minnesotan to show people. I took 26 years of hourly rainfall maps for the state, 2000 through 2025, and for each year I found the 72 hours that put the most water on Minnesota as a whole. Then I did the same for snow and found the day of each winter when the snowpack held the most water, its peak snow water equivalent.
The post has two dashboards, one for rain and one for snow. After them come the months when each kind of extreme tends to fall, a comparison with the Minnesota DNR's list of mega-rains, and the data and checks behind the numbers.
Every rainfall number in this post comes from one data set, NOAA's AORC, and every snow number from the University of Arizona's snow analysis. Another data set would give somewhat different amounts and could put the years in a different order. I show how much under What I checked.
The wettest 72 hours of every year
The dashboard below holds the rainfall result for every year. Pick a bar to see where the rain fell. The five largest events have hourly playback, so you can watch each storm build across the state while a red dot follows the statewide average.
The wettest 72 hours of each year in Minnesota
Statewide average rainfall, 2000 to 2025. Pick a year to see where the rain fell.
Hourly playback is available for the five largest events, shown in gold.

Click a bar or use the left and right arrow keys. Gold bars have hourly playback. Hover over the map to read the amount at any spot. All times are Central. Data: NOAA AORC.
What the number means
Each bar is a statewide average. Take all the rain that fell inside Minnesota in 72 hours and spread it evenly over the state's 84,154 square miles of land and inland lakes. The depth of that layer is the number.
The median year tops out at 1.94 inches. The largest, 2.39 inches, is about 8 percent of an average year's precipitation delivered in three days.
To score well on a statewide average, a storm has to rain on most of Minnesota. A cloudburst over two counties barely moves it. By this measure the wettest 72 hours of 2007 came at the end of March, five months before the Hokah flood.
I chose 72 hours because weather systems take one to three days to cross a state this size, and because it is the longest of the standard storm durations engineers use in design. It is also long enough to hold any event on the Minnesota DNR's list of mega-rains, which runs on a 24-hour clock.
The five largest since 2000
September 22 to 25, 2010 2.39 in
A warm front stalled across southern Minnesota, and waves of thunderstorms ran east along it for a day and a half. Amboy recorded 10.68 inches. The DNR put the area with six inches or more at over 5,000 square miles, and the grid gives about 5,200. Zumbro Falls, Pine Island, and Owatonna flooded. A week later the Mississippi at St. Paul rose above flood stage, the first autumn flood there in records going back to 1893.
This storm is also on the DNR's mega-rain list. It rained hard enough to wreck towns and widely enough to move the statewide number. Show 2010 on the map

July 9 to 12, 2016 2.31 in
The setup was similar, with a front lying across central Minnesota. Storms formed along it on the morning of July 11 and kept forming into the early hours of the 12th. Much of Pine County got more than eight inches, and Willow River measured 9.93. Southbound Interstate 35 closed for a time, Highway 61 closed, and tornadoes damaged homes in Watkins and Litchfield.
The grid's largest total for this storm, 11.4 inches, sits in Crow Wing County, 16 miles from Breezy Point, where a trained spotter reported 10.30. Show 2016 on the map
June 15 to 18, 2024 2.31 in
Most Minnesotans will remember this stretch. Rain fell across central and southern Minnesota over the weekend of June 15 and 16. Then on Tuesday the 18th the northeast got what the DNR called "one of the largest rains on record in northeastern Minnesota." Up to 7.5 inches fell at the headwaters of the St. Louis and Cloquet rivers, according to the National Weather Service in Duluth, and by the next afternoon downtown Cook was under water.
The rain then moved south. From June 20 to 22 far southern Minnesota took another six to nine inches, and on June 24 the Blue Earth River cut a new channel around the west side of the Rapidan Dam. That second round was devastating where it fell, and it covered far less of the state. Its best 72 hours average 1.25 inches statewide.
This entry comes with a caution, because NOAA's files are blank for all of June 18, 2024. I filled that day from a sister product, as described under What I checked. With the patch, 2024 lands 0.008 inches behind 2016, which is a tie for any practical purpose. Show 2024 on the map
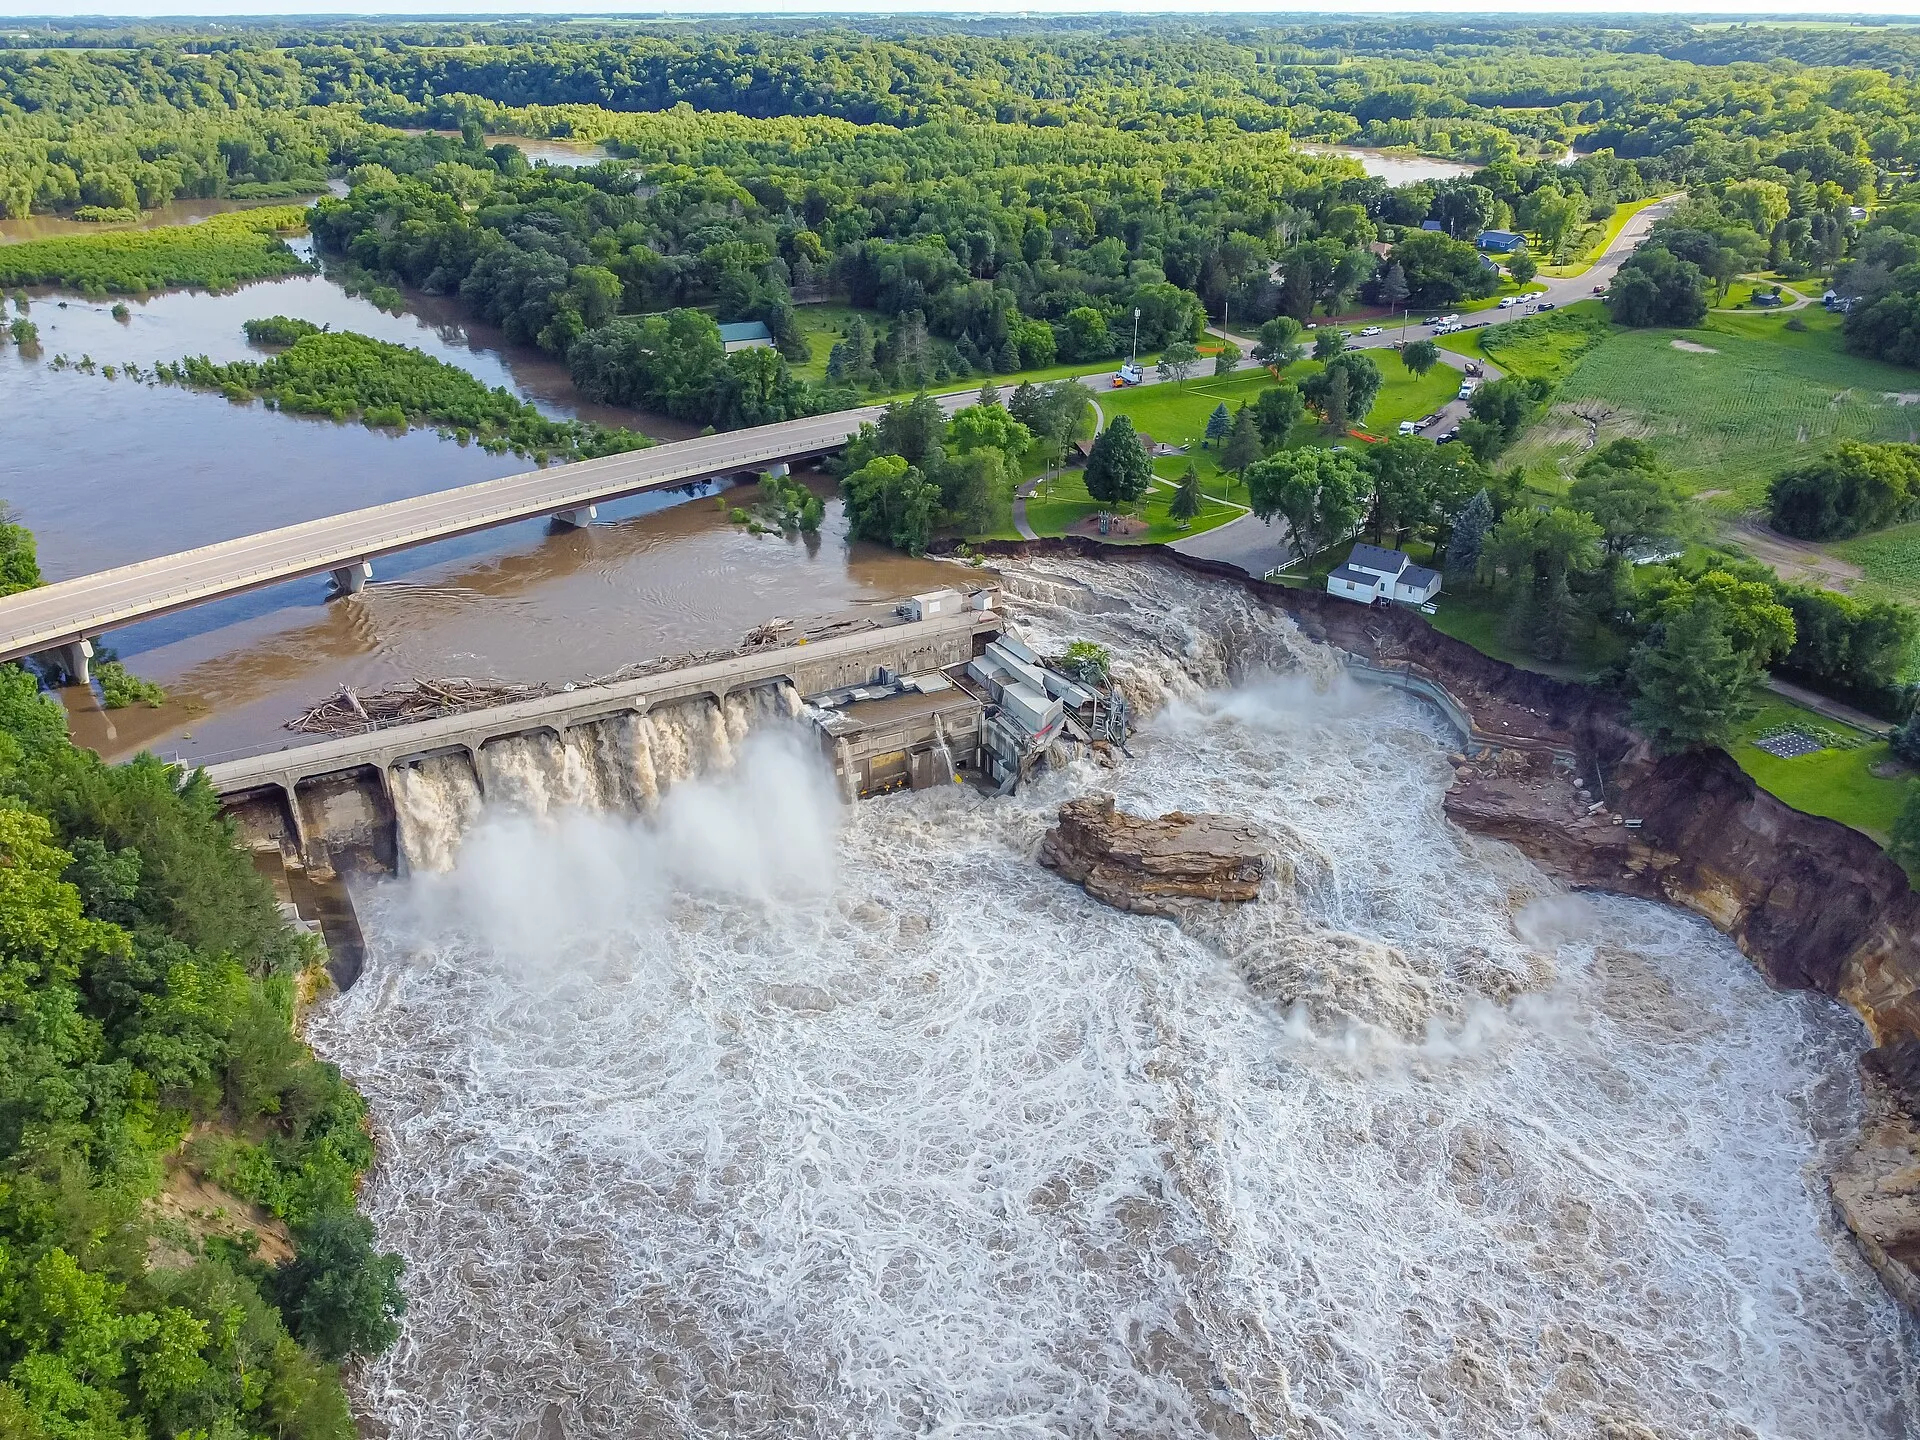
May 30 to June 2, 2014 2.25 in
Waves of thunderstorms crossed the state over a long weekend, first across the south and center and by Monday mostly in the north. A farm gauge near Sauk Centre caught 4.60 inches in one hour on the afternoon of May 31. The airport at Hibbing measured 5.96 inches in 54 hours and Big Falls 5.10, in the same county where the grid puts its largest total of 6.1 inches. Lake Minnetonka rose to its highest level in 109 years of records. In the grid, 93 percent of the state got at least an inch.
The rest of the month stayed wet. June 2014 averaged 8.03 inches statewide, the wettest month in Minnesota's record. A second 72-hour stretch from June 14 to 17 averaged 2.10 inches, which would place tenth on this list if a year could appear twice. The Rainy River passed a record that had stood since 1950, a hillside slid away below the University of Minnesota hospital in Minneapolis, and the governor declared an emergency in 35 counties. Show 2014 on the map
June 22 to 25, 2003 2.22 in
Rain came in rounds along a band about 30 miles wide, from Traverse County on the western border to Pine County on the eastern one. Five-day totals topped six inches along the band and eight in places. Elk River measured 8.19 inches in 24 hours and Monticello 7.50. The grid's largest total, 9.1 inches, sits four miles from Alexandria, where NOAA's storm records describe cars floating in the streets and three feet of water in the hospital's boiler room.
The evening of June 24 also brought 15 tornadoes. The strongest, an F2, went through Buffalo Lake in Renville County, and nobody was killed. Show 2003 on the map
The order of this list is soft. The five are separated by 0.17 inches, and the next four years sit within another 0.12. PRISM, a second rainfall data set I used as a cross-check, also has 2010 first and 2016 second. After that it ranks June 2013 third, June 2024 fourth, and October 2005 fifth, with 2014 sixth and 2003 eighth. Part of that gap comes from the clock, because PRISM's days run from morning to morning and my window can start at any hour. I would treat the first two as firm and the rest as a group of about nine storms of similar size.
Peak snow water equivalent of every winter
Many of Minnesota's largest river floods come from snow. The Red, the Minnesota, and the upper Mississippi rise in spring, when a winter's worth of snow melts in a few weeks. So I ran the same kind of search on snow.
The measure is snow water equivalent, SWE for short. Melt the snow on the ground and measure the depth of the water. A foot of fresh powder holds about an inch of water, and a foot of old, settled March snow can hold three or four.
For each winter from 1999-2000 through 2024-25, I found the day when the statewide average was largest. The maps come from the University of Arizona's daily snow analysis, described further down. A winter is labeled by the year in which it ends, so the bar for 2019 is the winter of 2018-19.
Peak snow water equivalent of each winter in Minnesota
Statewide average on each winter's peak day, 2000 to 2025. Snow water equivalent is the depth of water the snow would leave if it melted. Pick a winter to see where the snow was.
Daily playback is available for the five largest winters, shown in gold.

Click a bar or use the left and right arrow keys. Gold bars have daily playback from the first snow to the last. The circle on the map marks the deepest spot on the day shown. Days with snow on the ground statewide are days when the statewide average is at least 0.05 inches. Data: University of Arizona SWE.
The median winter peaks at 2.53 inches of water. That is more than the largest three-day rainfall of the 26 years, sitting on the ground at once.
The five largest winters
Winter of 2018-19 5.00 in
February 2019 was the snowiest February on record at 47 of Minnesota's long-running weather stations. The Twin Cities measured 39.0 inches for the month, and Rochester's 40.0 was about double its old February record. In early March the National Weather Service estimated three to seven inches of water in the snow across west-central and southwest Minnesota. The grid puts its deepest snow in the same part of the state. On March 19 it shows four inches or more over 82 percent of the state.
The Mississippi at St. Paul crested at 20.19 feet on March 31 and stayed above flood stage for 42 days, a record. Show 2018-19 on the map
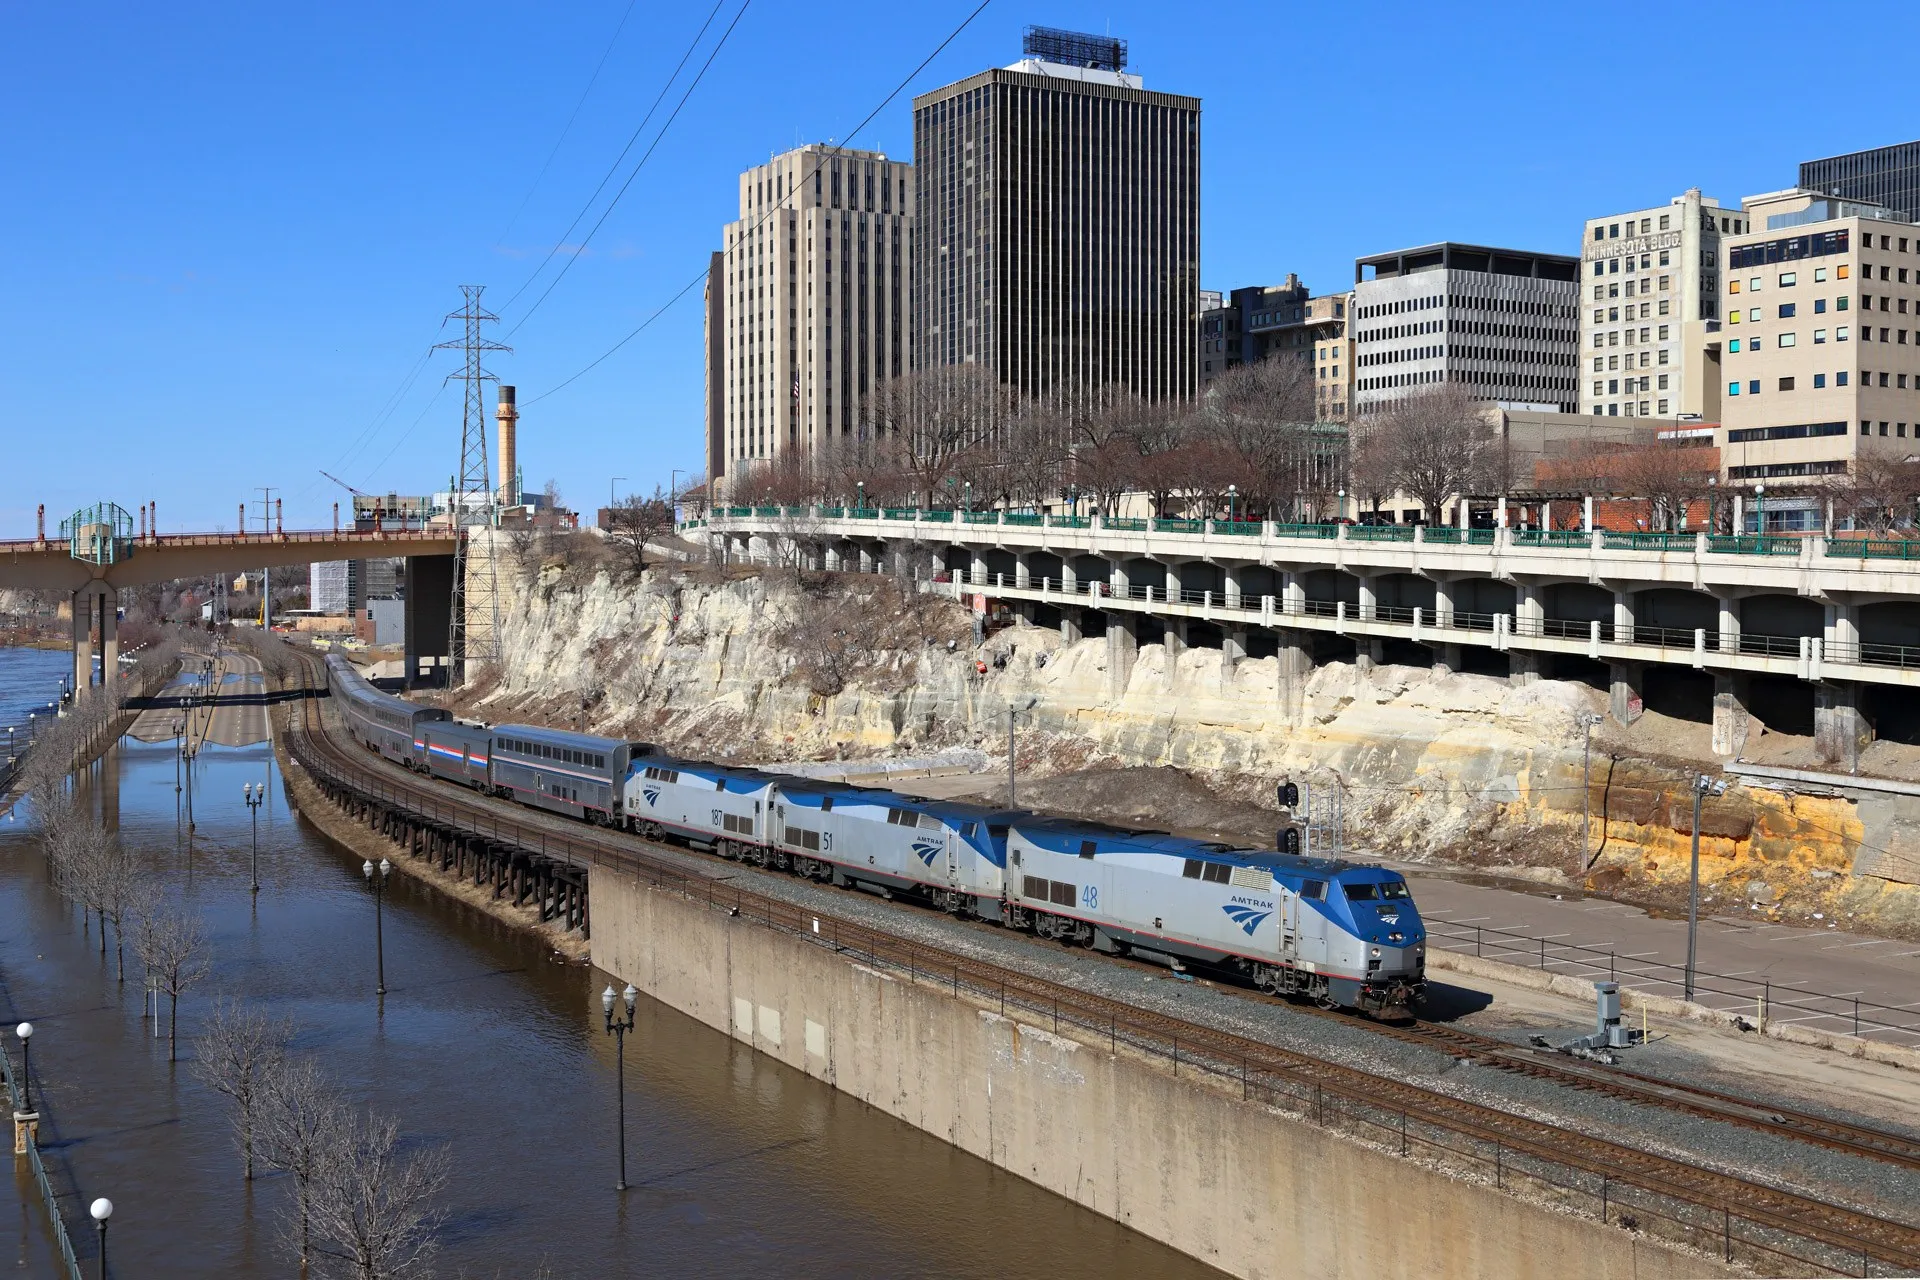
Winter of 2022-23 4.29 in
Duluth finished the season with 140.1 inches of snow, a record, and the Twin Cities with 90.3, their third snowiest. The peak came late, on April 7. The day before, about half of Minnesota still had 18 inches of snow or more on the ground.
Then came four days of record heat, with 88°F in the Twin Cities on April 12. By the 13th the snow was gone from southern and much of central Minnesota. The grid has the statewide average falling by 3.68 inches of water in the week ending April 15, the fastest loss in the 26 winters. The St. Croix at Stillwater crested in major flood on April 24, and the Mississippi at St. Paul crested at 18.13 feet a day later. Show 2022-23 on the map
Winter of 2010-11 3.84 in
This is the winter the Metrodome roof collapsed. The storm of December 10 and 11, 2010 left 17.1 inches at the Twin Cities airport, and the snow kept coming. In early March the DNR reported three to five inches of water in the snow at most Minnesota locations and six in parts of the west, a range that holds the grid's statewide 3.84. The deepest snow in the grid that winter is in the southwest, north of Pipestone.
The Red River at Fargo crested at 38.81 feet on April 9, the fourth highest in its record, and the Mississippi at St. Paul passed 19 feet on March 29. Show 2010-11 on the map

Winter of 2000-01 3.72 in
Snowfall ran 18 to 24 inches above average across much of southern Minnesota, and the DNR wrote that as of March 26 the snowpack statewide "generally contained two to four inches of water." The grid's peak, ten days before that date, is 3.72 inches.
The Mississippi at St. Paul crested at 23.76 feet on April 18. The DNR ranked the flood third highest on record at St. Paul and second highest at Stillwater and Granite Falls, and about 50 counties were declared disaster areas. Show 2000-01 on the map
Winter of 2012-13 3.70 in
The statewide peak came on March 20, and winter kept going for six more weeks. April 2013 brought Duluth 50.8 inches of snow, its snowiest month on record for any month of the year. In the storm of May 1 to 3, Dodge Center measured 15.4 inches in a day, a state record for May. The grid keeps snow on the ground statewide until May 7.
In early April the outlook for the Red River was a high risk of major flooding. The river stayed well below that, which the DNR credited to "a nearly ideal melt scenario." Fargo crested at 33.31 feet on May 1. Show 2012-13 on the map
At the other end, the winter of 2002-03 peaked at 1.02 inches. The winter of 2023-24, which the DNR called the lost winter, peaked at 1.27 inches on March 29. Its statewide average reached one inch of water on only 8 days, against 110 or more in each of the five winters above.
When the wettest 72 hours and the peak snow water equivalent fall, 1980 to 2025
This section uses a longer record than the rest of the post. AORC starts in 1980, and the Arizona snow analysis starts with the winter of 1981-82. A count by month is steadier with 46 years of rain and 44 winters of snow than with 26 of each, so here I kept all of them.
Wettest 72 hours, 1980 to 2025 Peak snow water equivalent, winters 1982 to 2025
The snow peaks first, and in a narrow window. The statewide peak falls in March in 27 of the 44 winters and in February in 15. The median date is March 7, and half of all peaks fall between February 23 and March 13. The earliest is February 2, in both 1998 and 1999, and the latest is April 17, 2018, the day after the blizzard of April 13 to 16.
The wettest 72 hours come later and spread over more of the year. June holds 12 of the 46 years. September and October hold 13 between them. July and August, the heart of thunderstorm season, hold 8.
My reading is that midsummer storms in Minnesota tend to be intense and compact, while the systems of June and early fall are broader and slower. Forty-six events cannot prove that, though the maps for June 2014 and September 2010 look the part.
In all 44 years with both records, the wettest 72 hours came after the snow peak, and the median gap is 131 days, a little over four months. The shortest gap is 2009. The snow peaked on March 11 that year, and the wettest 72 hours began on March 22 with about an inch and a half of water still in the snowpack statewide. Three days after that window closed, the Red River at Fargo reached its record crest of 40.84 feet.
Six of the 46 rainfall events came with cold air. In November 1996, 73 percent of the water fell with temperatures at or below 34°F, so most of it was snow and ice. March 2009 was 40 percent. AORC counts snow by its melted depth, and the rain dashboard flags the four such years since 2000 when you select them.
The oddest entry is 2023. The wettest 72 hours of that year ran from the evening of December 23 to the evening of December 26, a Christmas rainstorm in what the DNR described as an extremely warm, humid air mass. It put at least an inch on 84 percent of the state in a month when that water normally arrives as snow. Show 2023 on the map
How the DNR's mega-rains rank
The rainfall ranking is easier to judge next to a list that people in the state's water community already know, the one kept by the Minnesota DNR. An event is a mega-rain when six inches of rain covers more than 1,000 square miles in 24 hours or less, with at least eight inches somewhere inside that area. Eleven events on the list fall between 2000 and 2025.
One thousand square miles is 1.2 percent of Minnesota. A storm can meet the DNR's test and leave nine tenths of the state dry, so I expected the two lists to differ. They overlap about half the time. Six of the eleven mega-rains are also the wettest 72 hours of their year statewide.
| Mega-rain on the DNR list | Where | Statewide, best 72 hours | Largest of that year | Same storm |
|---|---|---|---|---|
| Jun 9 to 10, 2002 | Roseau and Lake of the Woods | 1.58 in | 1.86 in | No |
| Jun 22 to 23, 2002 | Northern Minnesota | 1.86 in | 1.86 in | Yes |
| Sep 14 to 15, 2004 | Faribault and Freeborn counties | 2.02 in | 2.02 in | Yes |
| Sep 24 to 25, 2005 | Fairmont and Winnebago | 1.02 in | 2.10 in | No |
| Oct 4 to 5, 2005 | East-central Minnesota | 2.10 in | 2.10 in | Yes |
| Aug 18 to 20, 2007 | Southeast Minnesota, near Hokah | 1.48 in | 1.85 in | No |
| Sep 22 to 23, 2010 | Southern Minnesota, Amboy | 2.39 in | 2.39 in | Yes |
| Jun 19 to 20, 2012 | Duluth and the North Shore | 2.15 in | 2.15 in | Yes |
| Jul 11 to 12, 2016 | Brainerd Lakes to Pine County | 2.31 in | 2.31 in | Yes |
| Aug 10 to 11, 2016 | Willmar and Wabasha County | 1.90 in | 2.31 in | No |
| Jul 25 to 26, 2020 | Southern Minnesota, near Mankato | 1.04 in | 1.80 in | No |
Hokah is the clearest case. In August 2007 a gauge one mile south of town collected 15.10 inches in 24 hours, which is still the state record. The best 72 hours around that storm average 1.48 inches statewide. The wettest 72 hours of 2007 came at the end of March, a 1.85-inch mix of rain and wet snow that I doubt many people remember.

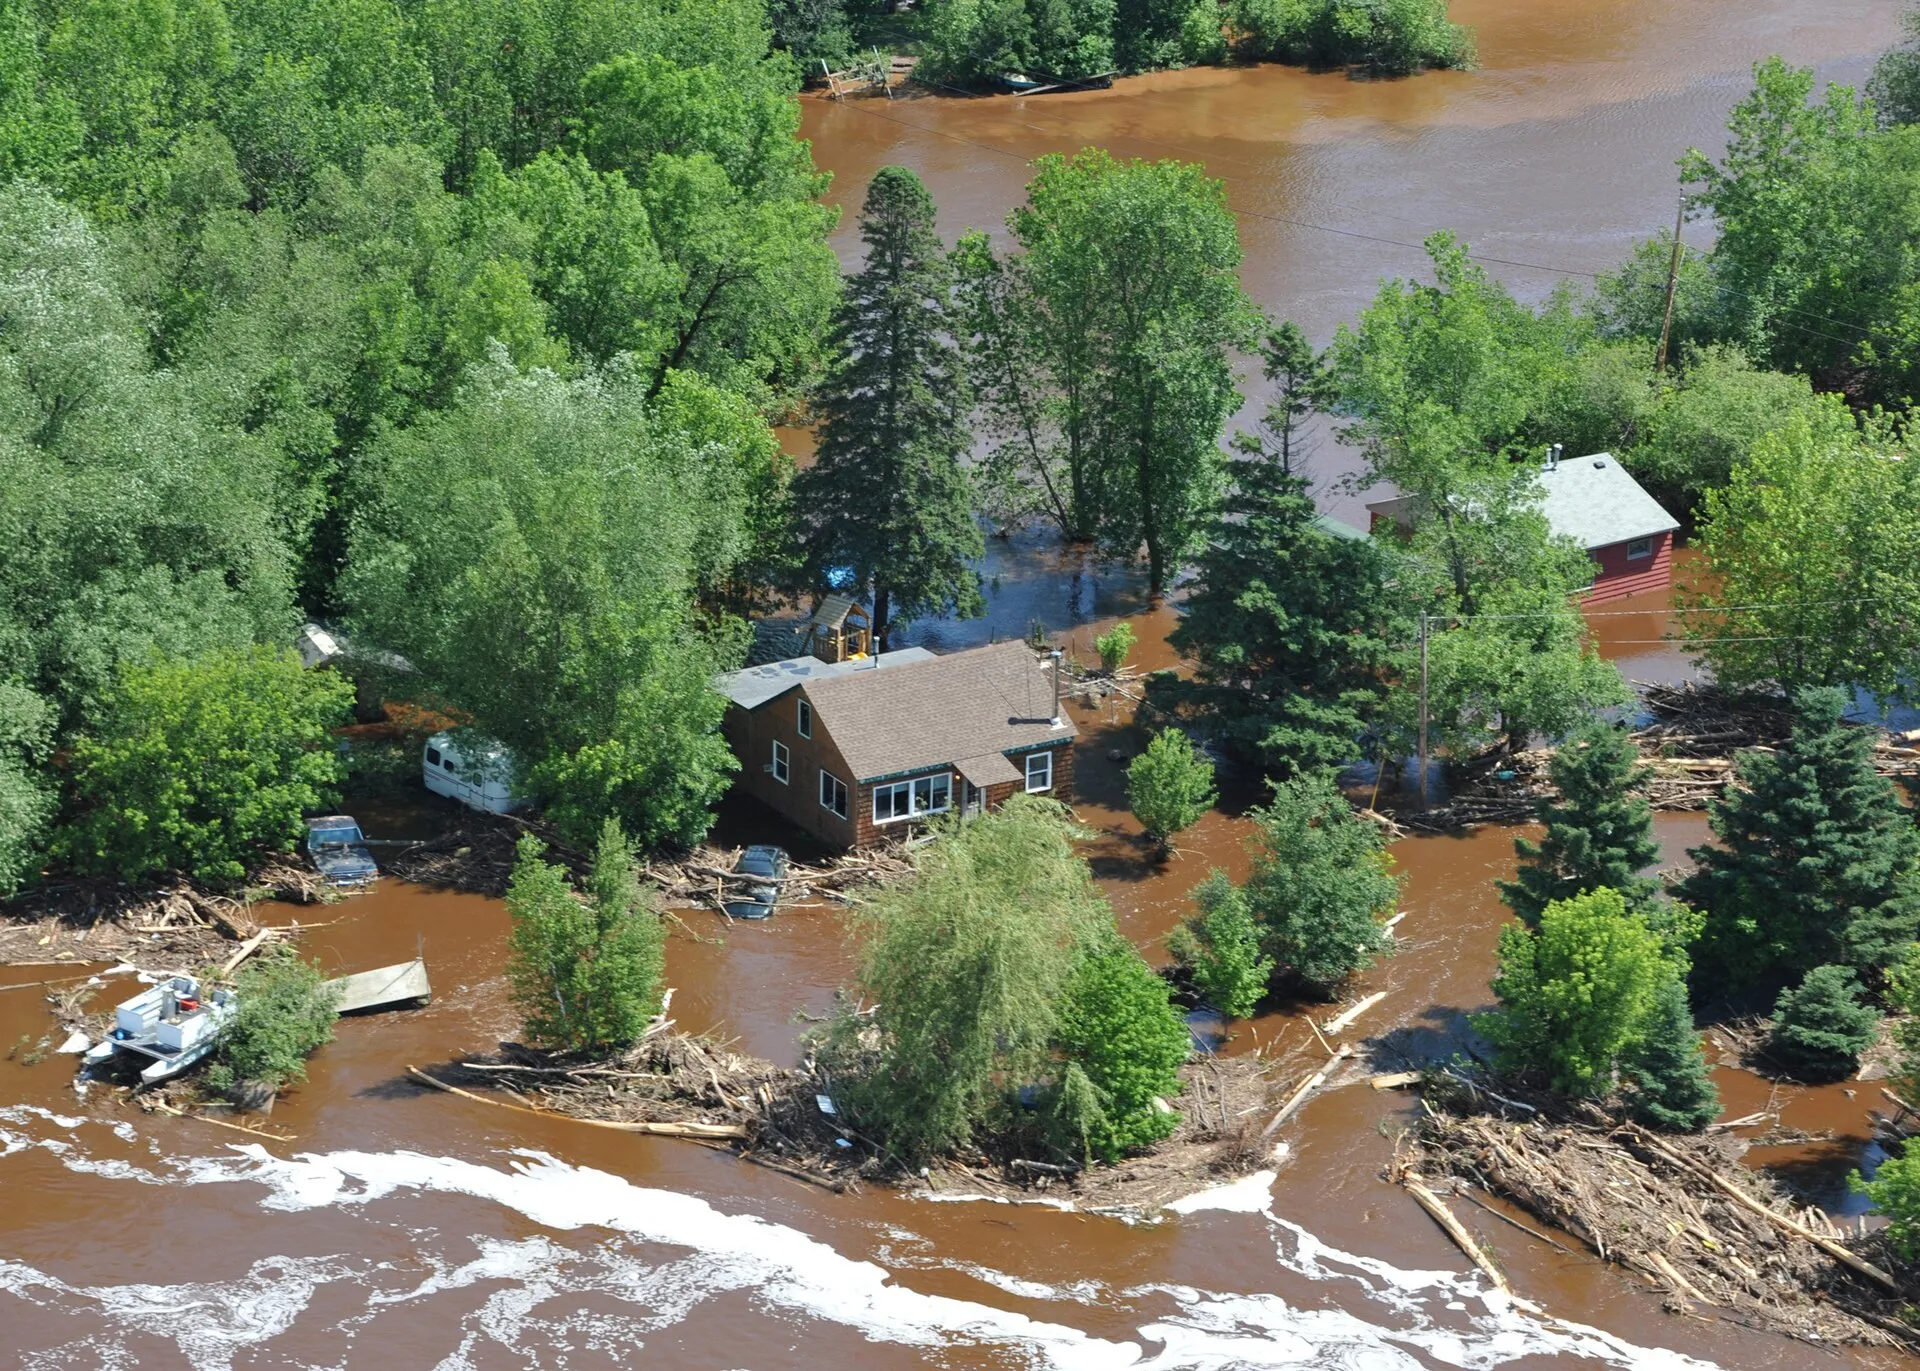
Where the rainfall data comes from
The rainfall maps come from NOAA's Analysis of Record for Calibration, AORC for short. It is an hourly estimate of precipitation on a grid of cells about half a mile across, covering the lower 48 states from 1979 to the present. NOAA built it to calibrate river forecast models, and it is free to download.
AORC is assembled from other measurements, and the ingredients change over time. Through 2001 the daily totals come from an analysis of rain gauges on a 12-kilometer grid, and older radar summaries decide how each day's total is split among its hours. From 2002 on, daily and hourly amounts come from Stage IV, a blend of weather radar and rain gauges at about 4 kilometers. The half-mile grid is finer than the information inside it.
The processing has four steps.
- I cut out Minnesota using the DNR's state boundary, trimmed at the Lake Superior shoreline so the average covers land and inland lakes.
- For each of the 227,928 hours I averaged the rainfall over the state, weighting every cell by its area.
- I slid a 72-hour window along that series and kept the window with the largest total in each calendar year, on Central Time.
- For each of those 26 windows I went back to the maps to measure where the rain fell.
Where the snow data comes from
The snow maps come from the University of Arizona's daily snow water equivalent and snow depth analysis, which covers the lower 48 states from October 1981. According to its documentation, it combines daily temperature and precipitation grids from PRISM, snow water and snow depth measured at SNOTEL stations, and snow depth reported by National Weather Service cooperative observers. I used the version on an 800-meter grid.
SNOTEL stations weigh the snowpack directly, and they are a mountain network. Minnesota has none. In this state the water content is worked out from observed snow depth and from the weather, so every snow number in this post is an estimate built on depth.
The steps match the rainfall ones. I cut Minnesota out of each daily national map, averaged over the state with every cell weighted by its area, and kept the day with the largest average in each winter. The grid has no values over the largest lakes, such as Lake of the Woods, the Red Lakes, and Mille Lacs. Those 1,228 square miles are left out of the average, and the map fills them from the nearest shore.
What I checked
I tested the rainfall grid in two ways and the snow grid in one.
First, I compared every day of rainfall against PRISM, an independent grid built mainly from rain gauge observations, using statewide daily averages from the ACIS service. Over 9,497 days the two track each other closely. They name the same storm as the year's largest three-day total in 24 of 26 years, and for that storm AORC is within 10 percent of PRISM in 21 of them. The two still rank the years differently, as the list of five above shows.
Second, I compared each of the 26 events with rain gauges, one gauge against the grid cell it sits in, 10,120 comparisons in all. AORC's average at the gauges is within 10 percent of the gauge average in 24 of 26 events.
The first check caught two bad days. For May 30, 2022, AORC holds 1.39 inches statewide where PRISM and Stage IV both hold about half an inch. Until I caught it, Memorial Day weekend 2022 sat near the top of this list. With the day corrected, the wettest 72 hours of 2022 fall in mid-May and rank 20th. For October 2, 2009, the error runs the other way. I replaced both days with Stage IV, hour by hour.
A third problem was already known. NOAA announced in April 2026 that a small share of AORC had been blanked by mistake and that corrected files were on the way. One of the blanks is all of June 18, 2024, the day of the northeast Minnesota flood. I filled it from Stage IV as well. On the hours next to the gap, the two products agree within one percent.
For snow, I compared the Arizona grid with SNODAS, NOAA's own daily snow analysis, which begins in the fall of 2003. For each of the 22 winters since then I took the SNODAS map for my peak day and for the days one, two, and three weeks to either side. On the peak day the Arizona statewide average is within 20 percent of SNODAS in 15 winters, and the middle case is 5 percent lower.
The two products pick the same five winters as the largest since 2004, and they order them differently. SNODAS puts 2012-13 second, ahead of 2022-23. The winter of 2000-01 is older than SNODAS, so 2013-14 takes its place in that comparison. The widest gap is in 2018, when the Arizona grid holds 2.81 inches the day after the April blizzard and SNODAS holds 1.77. The official statements quoted above, such as three to five inches in March 2011, are a looser check, and the statewide numbers sit inside them.
Limits
- These are results from AORC and from the University of Arizona snow analysis. Other data sets give different amounts and can reorder the years, as PRISM and SNODAS do above.
- A grid cell is an average over an area, and it reads lower than a gauge at the core of a storm. For Hokah the largest 24-hour cell value is 12.7 inches, against 15.10 at the gauge.
- The window is fixed at 72 hours and the year runs January through December. A different window length would reorder some years.
- For a few of the 26 events, AORC differs from PRISM or from the gauges by up to about 20 percent, so small differences between years carry little weight.
- The count by month reaches back to 1980, when AORC was built from coarser inputs. I trust those early years for the date of a storm more than for its map.
- Snow water in Minnesota is estimated from snow depth. The two snow products also disagree on how fast the snow leaves. A week after the 2019 peak, SNODAS had lost about 40 percent of the water and the Arizona grid about 10 percent.
- The statewide snow peak is one day for the whole state. The north usually peaks later than the south, so on that day the south may already be melting.
- Twenty-six years is a short record for extremes.
Before 2000 and after 2025
The rankings start in 2000. For older storms, the DNR's mega-rain list reaches back much further. It includes the flood of July 1867, the July 1909 storm that dropped 10.75 inches in a day at Beaulieu, the Fort Ripley storm of July 1972, and two events in northwest Minnesota in the summer of 1975.
At the other end, AORC stops at December 2025 for now. The mega-rain of July 1 and 2, 2026 in southeast Minnesota, with 8.28 inches at Mabel and six inches or more over slightly more than 1,000 square miles, is too recent to appear here. The DNR, the National Weather Service in La Crosse, and KTTC have the details. The snow files I used also end in December 2025, so the winter of 2025-26 is not included.
For snow, the largest winter in the Arizona data falls just outside the window. The winter of 1996-97 peaks at 5.70 inches on March 15, 1997, above every winter since 2000. That was the spring the Red River reached its record crest at Grand Forks.
About the colors
The rain maps use Nasir and the snow maps use Iwan. Both are palettes from Rang, my collection of color palettes drawn from Persian art, which I wrote about in The story behind Rang.
Nasir comes from the stained glass of the Nasir al-Mulk Mosque in Shiraz. It runs from violet through cobalt, cyan, and green to gold and vermilion, so light rain stays dark and quiet while the heaviest totals glow. Iwan comes from the tiled entrance of the Shah Mosque in Isfahan. It runs from gold to deep blue, so bare ground shows as gold and the deepest snow as navy.
Tahmasebi Nasab, M. (2026). Rang: color palettes from Persian art, version 0.3.0. github.com/mohsennasab/Rang
Sources
- NOAA National Weather Service, Office of Water Prediction. Analysis of Record for Calibration, version 1.1, accessed October 10, 2026. Methods: Sources, Methods, and Verification. Paper: Fall and others, 2023.
- Broxton, P., X. Zeng, and N. Dawson. University of Arizona daily SWE and snow depth, 800 m, with its readme. The 4 km version is archived at NSIDC. Papers: Zeng, Broxton, and Dawson, 2018, and Broxton and others, 2024.
- National Operational Hydrologic Remote Sensing Center. Snow Data Assimilation System (SNODAS) data products at NSIDC.
- Minnesota DNR State Climatology Office. Historic Mega-Rain Events in Minnesota, and the climate journal pages for June 2003, August 2007, September 2010, May 31 to June 2, 2014, June 2014, July 2016, Christmas 2023, June 2024, and July 2026.
- Minnesota DNR State Climatology Office, on snow: the December 2010 blizzard, the May 2013 snowstorm, record snows of February 2019, the winter of 2022-23, the April 2023 heat wave, and the lost winter of 2023-24. HydroClim Minnesota for April 2001, May 2001, March 2011, April 2013, May 2013, and July 2014.
- Minnesota DNR. State Boundary, Minnesota. County outlines and the Lake Superior shoreline are from U.S. Census Bureau cartographic boundary files.
- PRISM Climate Group, Oregon State University, daily precipitation, and daily rain gauge records, both through the Applied Climate Information System of the NOAA Regional Climate Centers.
- NCEP Stage IV hourly precipitation analysis, from the Iowa Environmental Mesonet archive.
- National Weather Service pages on the June 24, 2003 tornado outbreak, the March 2019 flooding, the June 2024 flood in northeast Minnesota, and the July 2026 heavy rain. River crests are from the National Water Prediction Service pages for St. Paul, Stillwater, and Fargo. Storm reports are from the NOAA Storm Events Database.
- U.S. Geological Survey. Fact sheet on the spring 2001 flooding in Minnesota. USDA Natural Resources Conservation Service, map of SNOTEL stations.
- News coverage from the Minnesota Reformer, MPR News and the Associated Press, MPR News on the 2019 flood, and KTTC.
If you are at either conference, come say hello.
Mohsen :)