Back from Rochester
I spent November 4 and 5 in Rochester at the Minnesota Association of Floodplain Managers conference, and I came home with a full notebook. I learned a lot about how floodplains are managed across Minnesota, from mapping and regulations to the local projects that protect homes and businesses. I also heard the first ideas for a Minnesota Flood Center, and I am curious to see where that goes.
My own talk was about communication. I argued that we should design our communication as carefully as we design our technical solutions, and that the design should start with the people who need to understand and use the results. I also showed how supervised agentic AI is helping us try new ways of communicating, with an engineer checking what the agents produce at every step. To my surprise, the talk won one of the conference's best speaker awards.
It was great to see that floodplain professionals in our state agree that communication is a key part of what we do. That talk is also the reason this post exists. Before the conference I wanted to try what I was about to recommend, so I took Rochester's flood of 1978 and tried to tell its story with maps and charts that someone without an engineering degree could follow. Most of this post is that work. First, though, the part of the trip I had been waiting for.
The field tour
On the afternoon of November 4, the conference field tour took us around Rochester's flood control system. I had spent weeks with a plate printed in 1979, so it was a treat to stand at the places it shows and see what was built after the water went down. We made five stops.
- Silver Lake Dam, just north of downtown, where the old low-head dam that holds Silver Lake is being replaced with a rock arch rapids, and we watched excavators breaking it up while the lake was drawn down.
- The Bear Creek levee, about 3,100 feet long, which protects Mayo High School, Holy Trinity Church, and the properties west of the Bear Creek channel.
- Gamehaven Reservoir, one of the flood control reservoirs on Willow Creek south of the city, where an earthen dam holds back runoff before it reaches Rochester.
- Willow Creek Reservoir, a second reservoir on the creek's west fork, about 70 acres in size according to the 2003 South Zumbro watershed plan.
- The upstream drop structure on the South Fork Zumbro River, a concrete step that lowers the river at one controlled spot so the enlarged flood channel downstream does not erode its own bed.
Select a photo to see it larger.
Every stop on the tour traces back to the flood in this post. After July 1978 the Corps of Engineers, Olmsted County, and the City built the project in stages, and the Corps history and the documents listed further down tell that story. Willow Creek, where we saw the two reservoirs, drains into Bear Creek, and Bear Creek's peak in 1978 is one of the numbers on the plate that surprised me most. hills south of town.
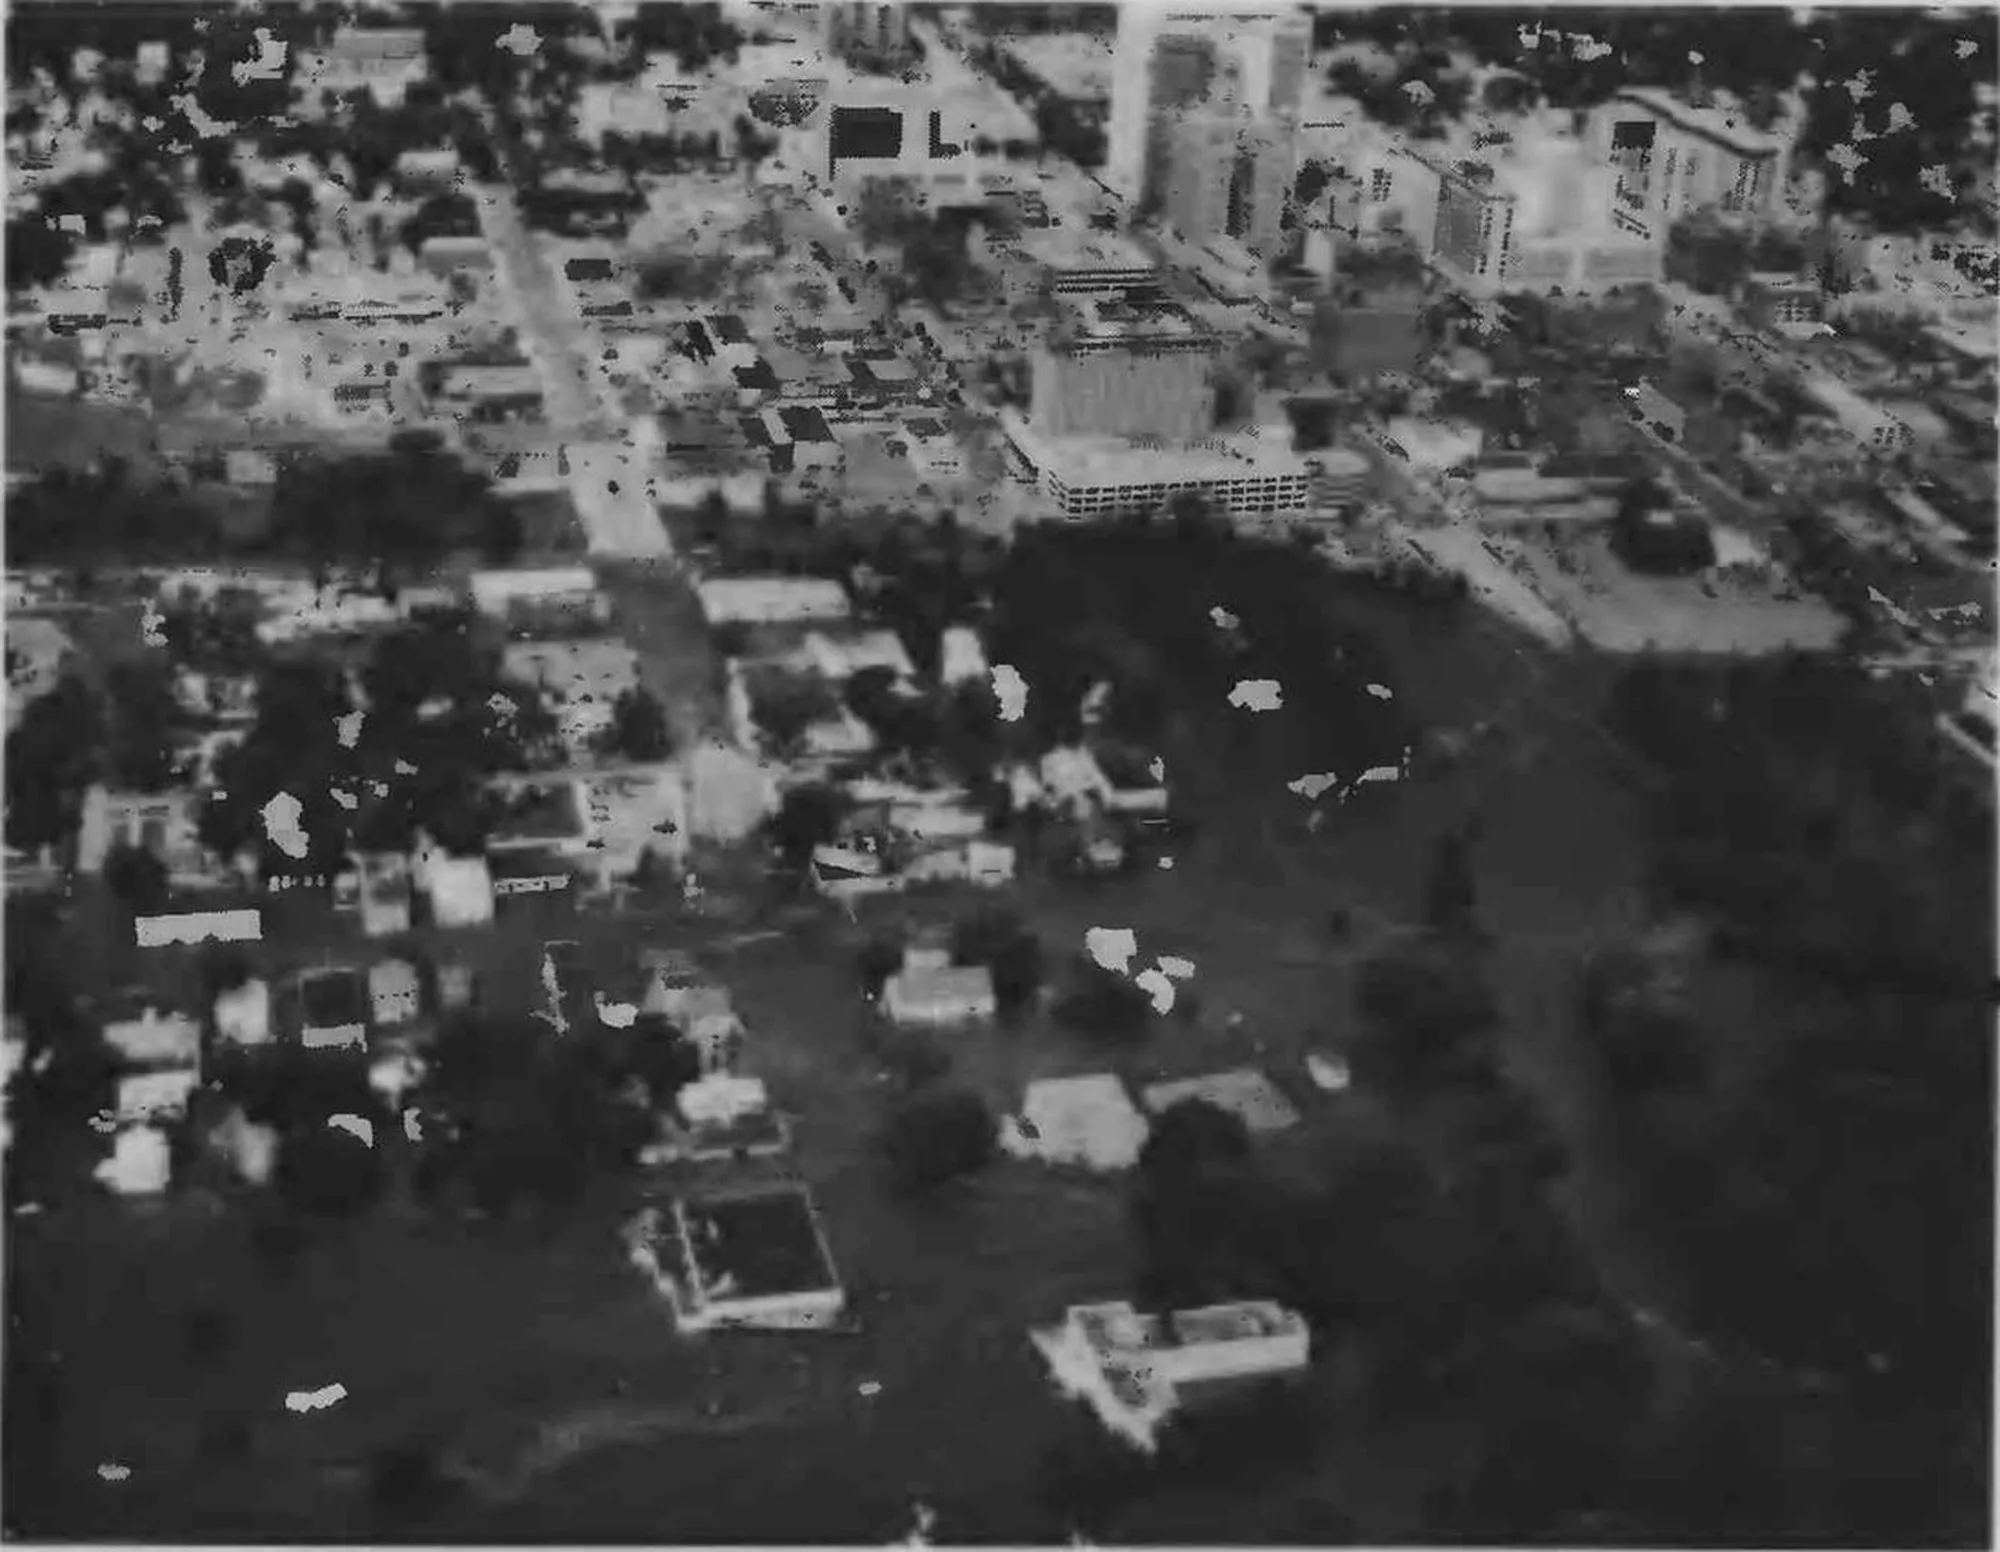
The tour also changed how I read one of my own maps. Silver Lake is the dark bulge in the river on the 1979 photomosaic, and today's imagery in the then-and-now map below still shows a lake there. By next fall that spot will be a set of rapids.
Why I went looking at 1978
I like to know something about a city before I show up in it, and for a water resources engineer in Rochester, the place to start is the flood of July 1978. It also fit my talk. If I was going to tell a room of floodplain managers that the way we present our work deserves as much care as the analysis, I wanted to try that on a real event first. I wrote what follows the week before the conference.
The flood reached me through one sheet of paper. In 1979 the U.S. Geological Survey published a single large plate on it, with an aerial photomosaic of the flooded river, 14 photographs, a rainfall map, a river graph, and two pieces of the Rochester Post-Bulletin. I take photographs in my free time, so the pictures caught me before the numbers did. A shopping mall, a park entrance, a civic center, each of them standing in brown water.
I was not there in 1978, but what I can do is read the record closely, explain some of the engineering, and remember that this was a disaster people in Rochester had to live through. I started out to summarize the plate. Along the way the airport's old weather logs turned up a small puzzle about what time the rain began, which I describe below.
The plate, in black and white and in color
Before getting into the details, let me show you the plate I keep talking about. V. J. Latkovich of the U.S. Geological Survey prepared it with the Minnesota Department of Natural Resources, and USGS published it in 1979 as Open-File Report 79-1583. Its two newspaper pieces come from the Rochester Post-Bulletin.
Drag across the plate below. The left side shows the original. The right side shows a copy I colorized with code to make the photographs easier to look at. The buttons jump to parts worth a closer look.
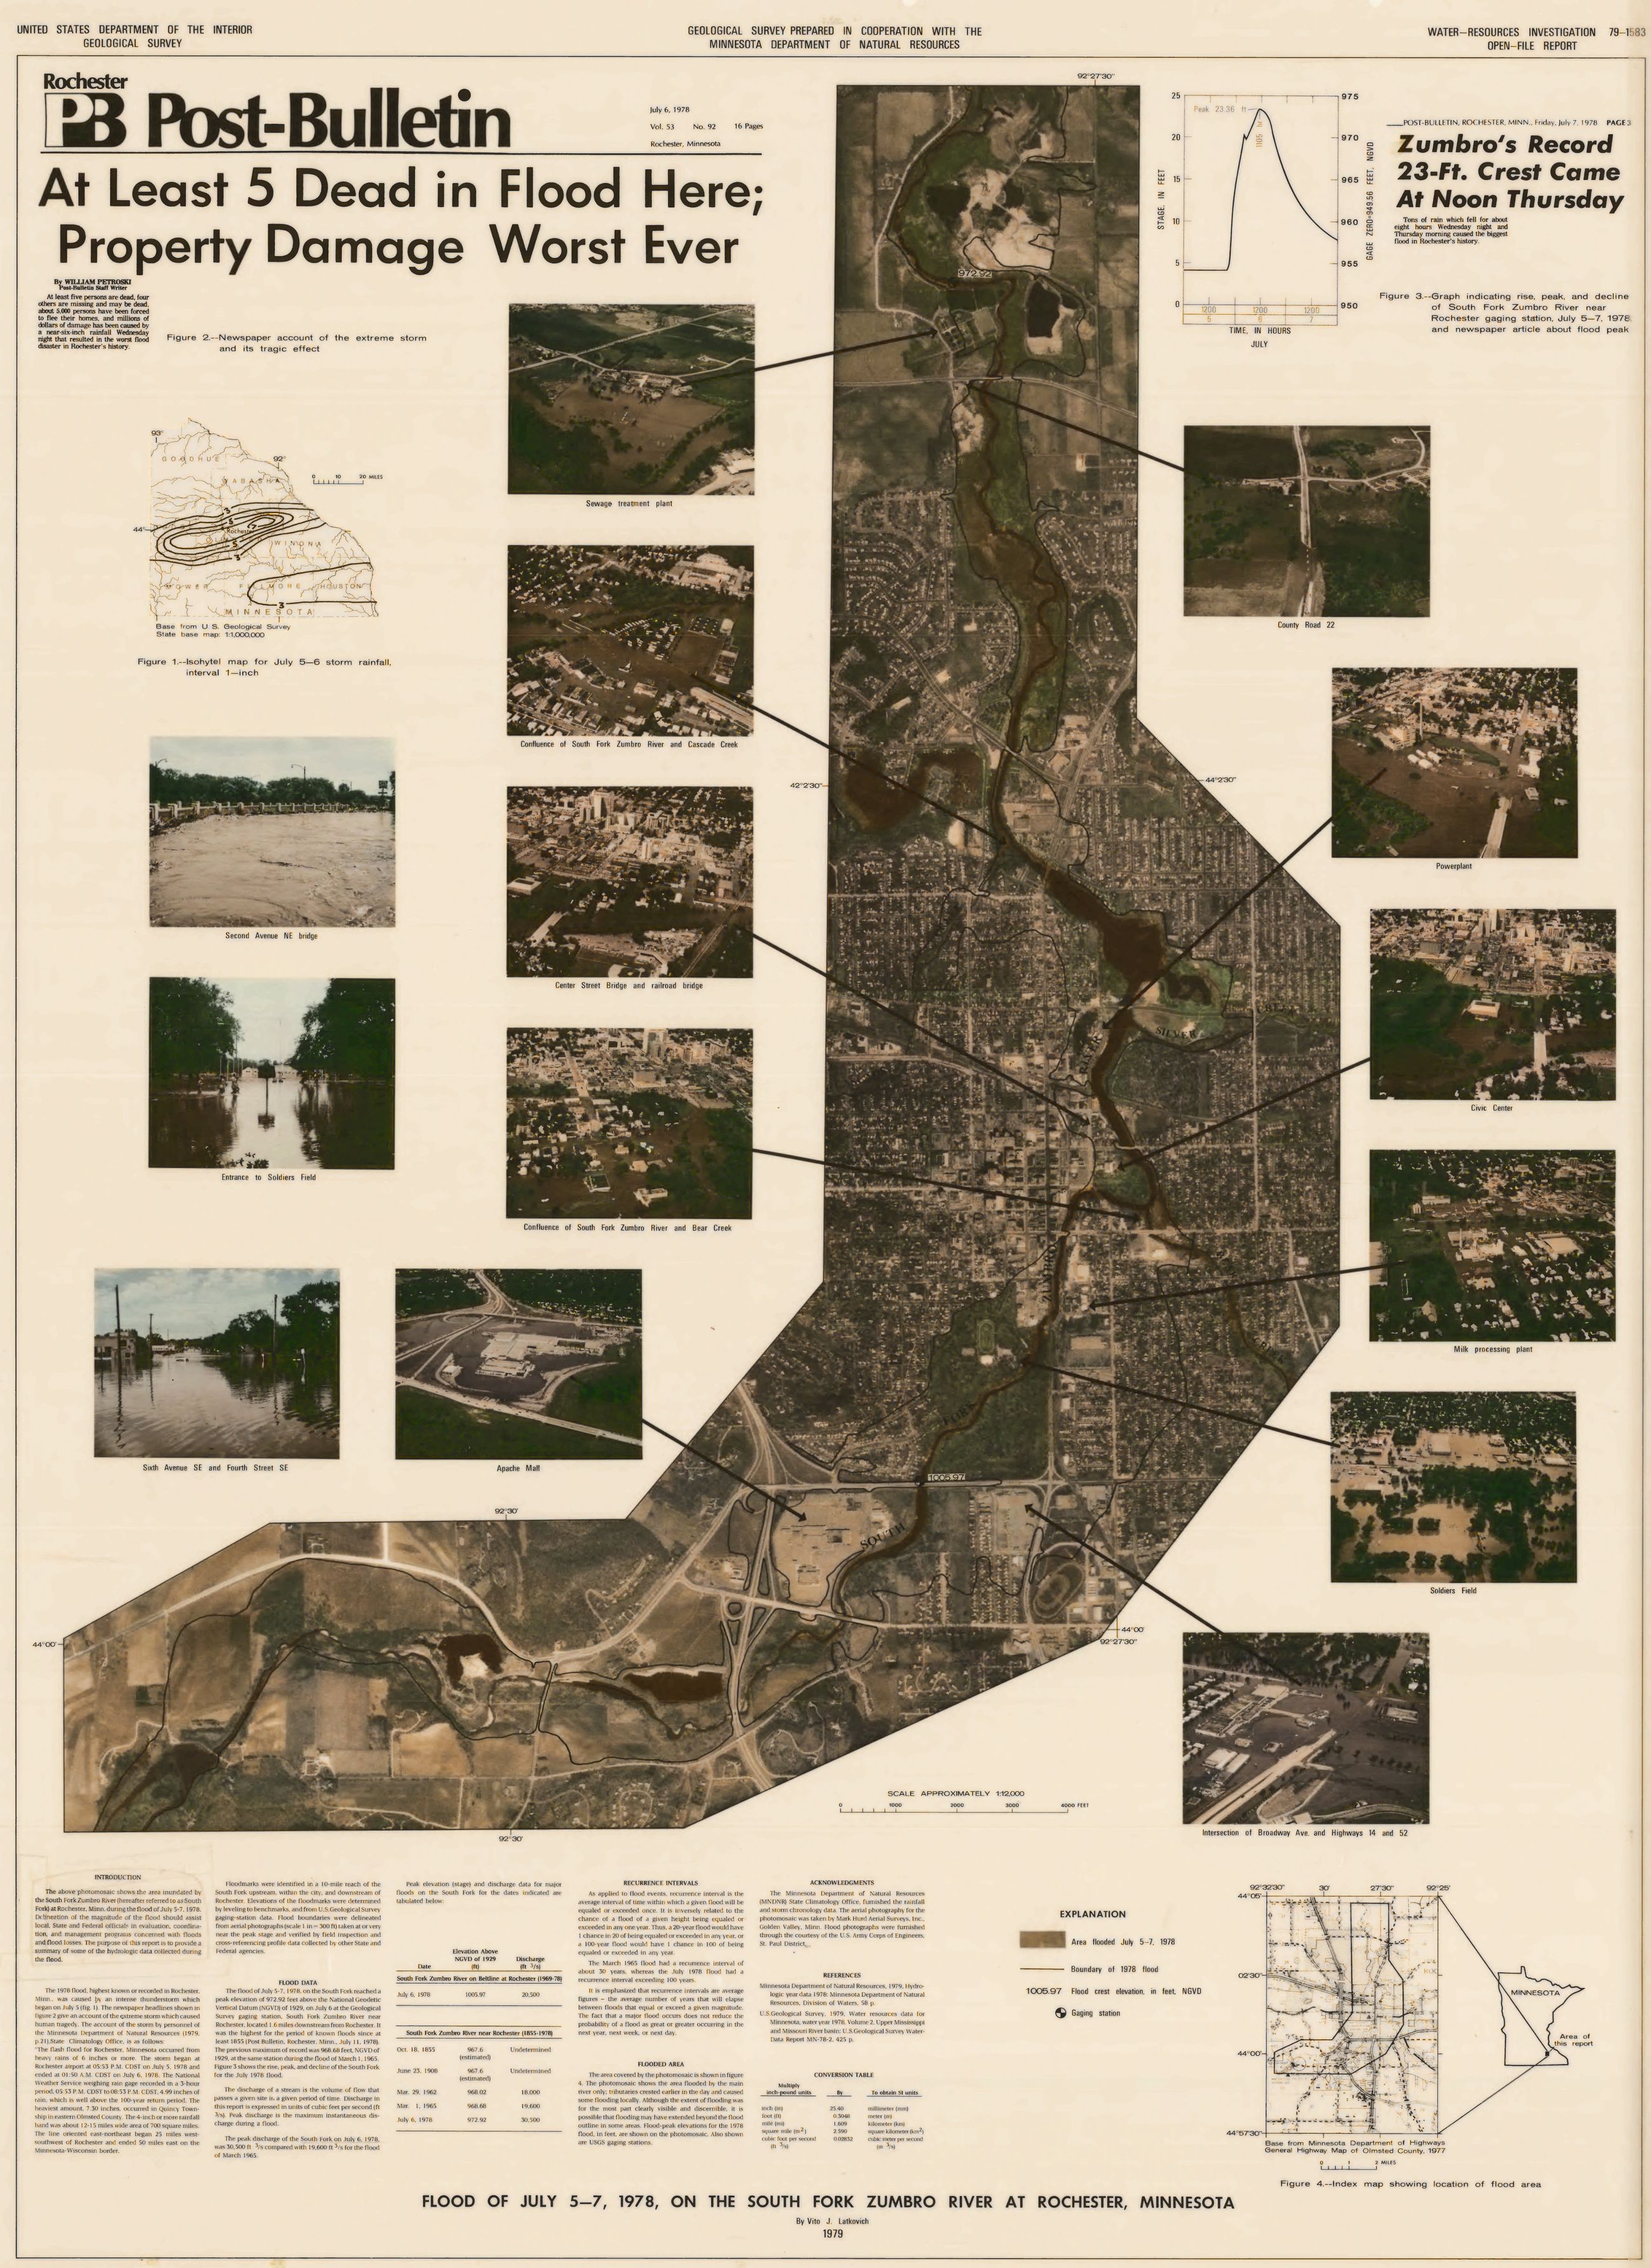
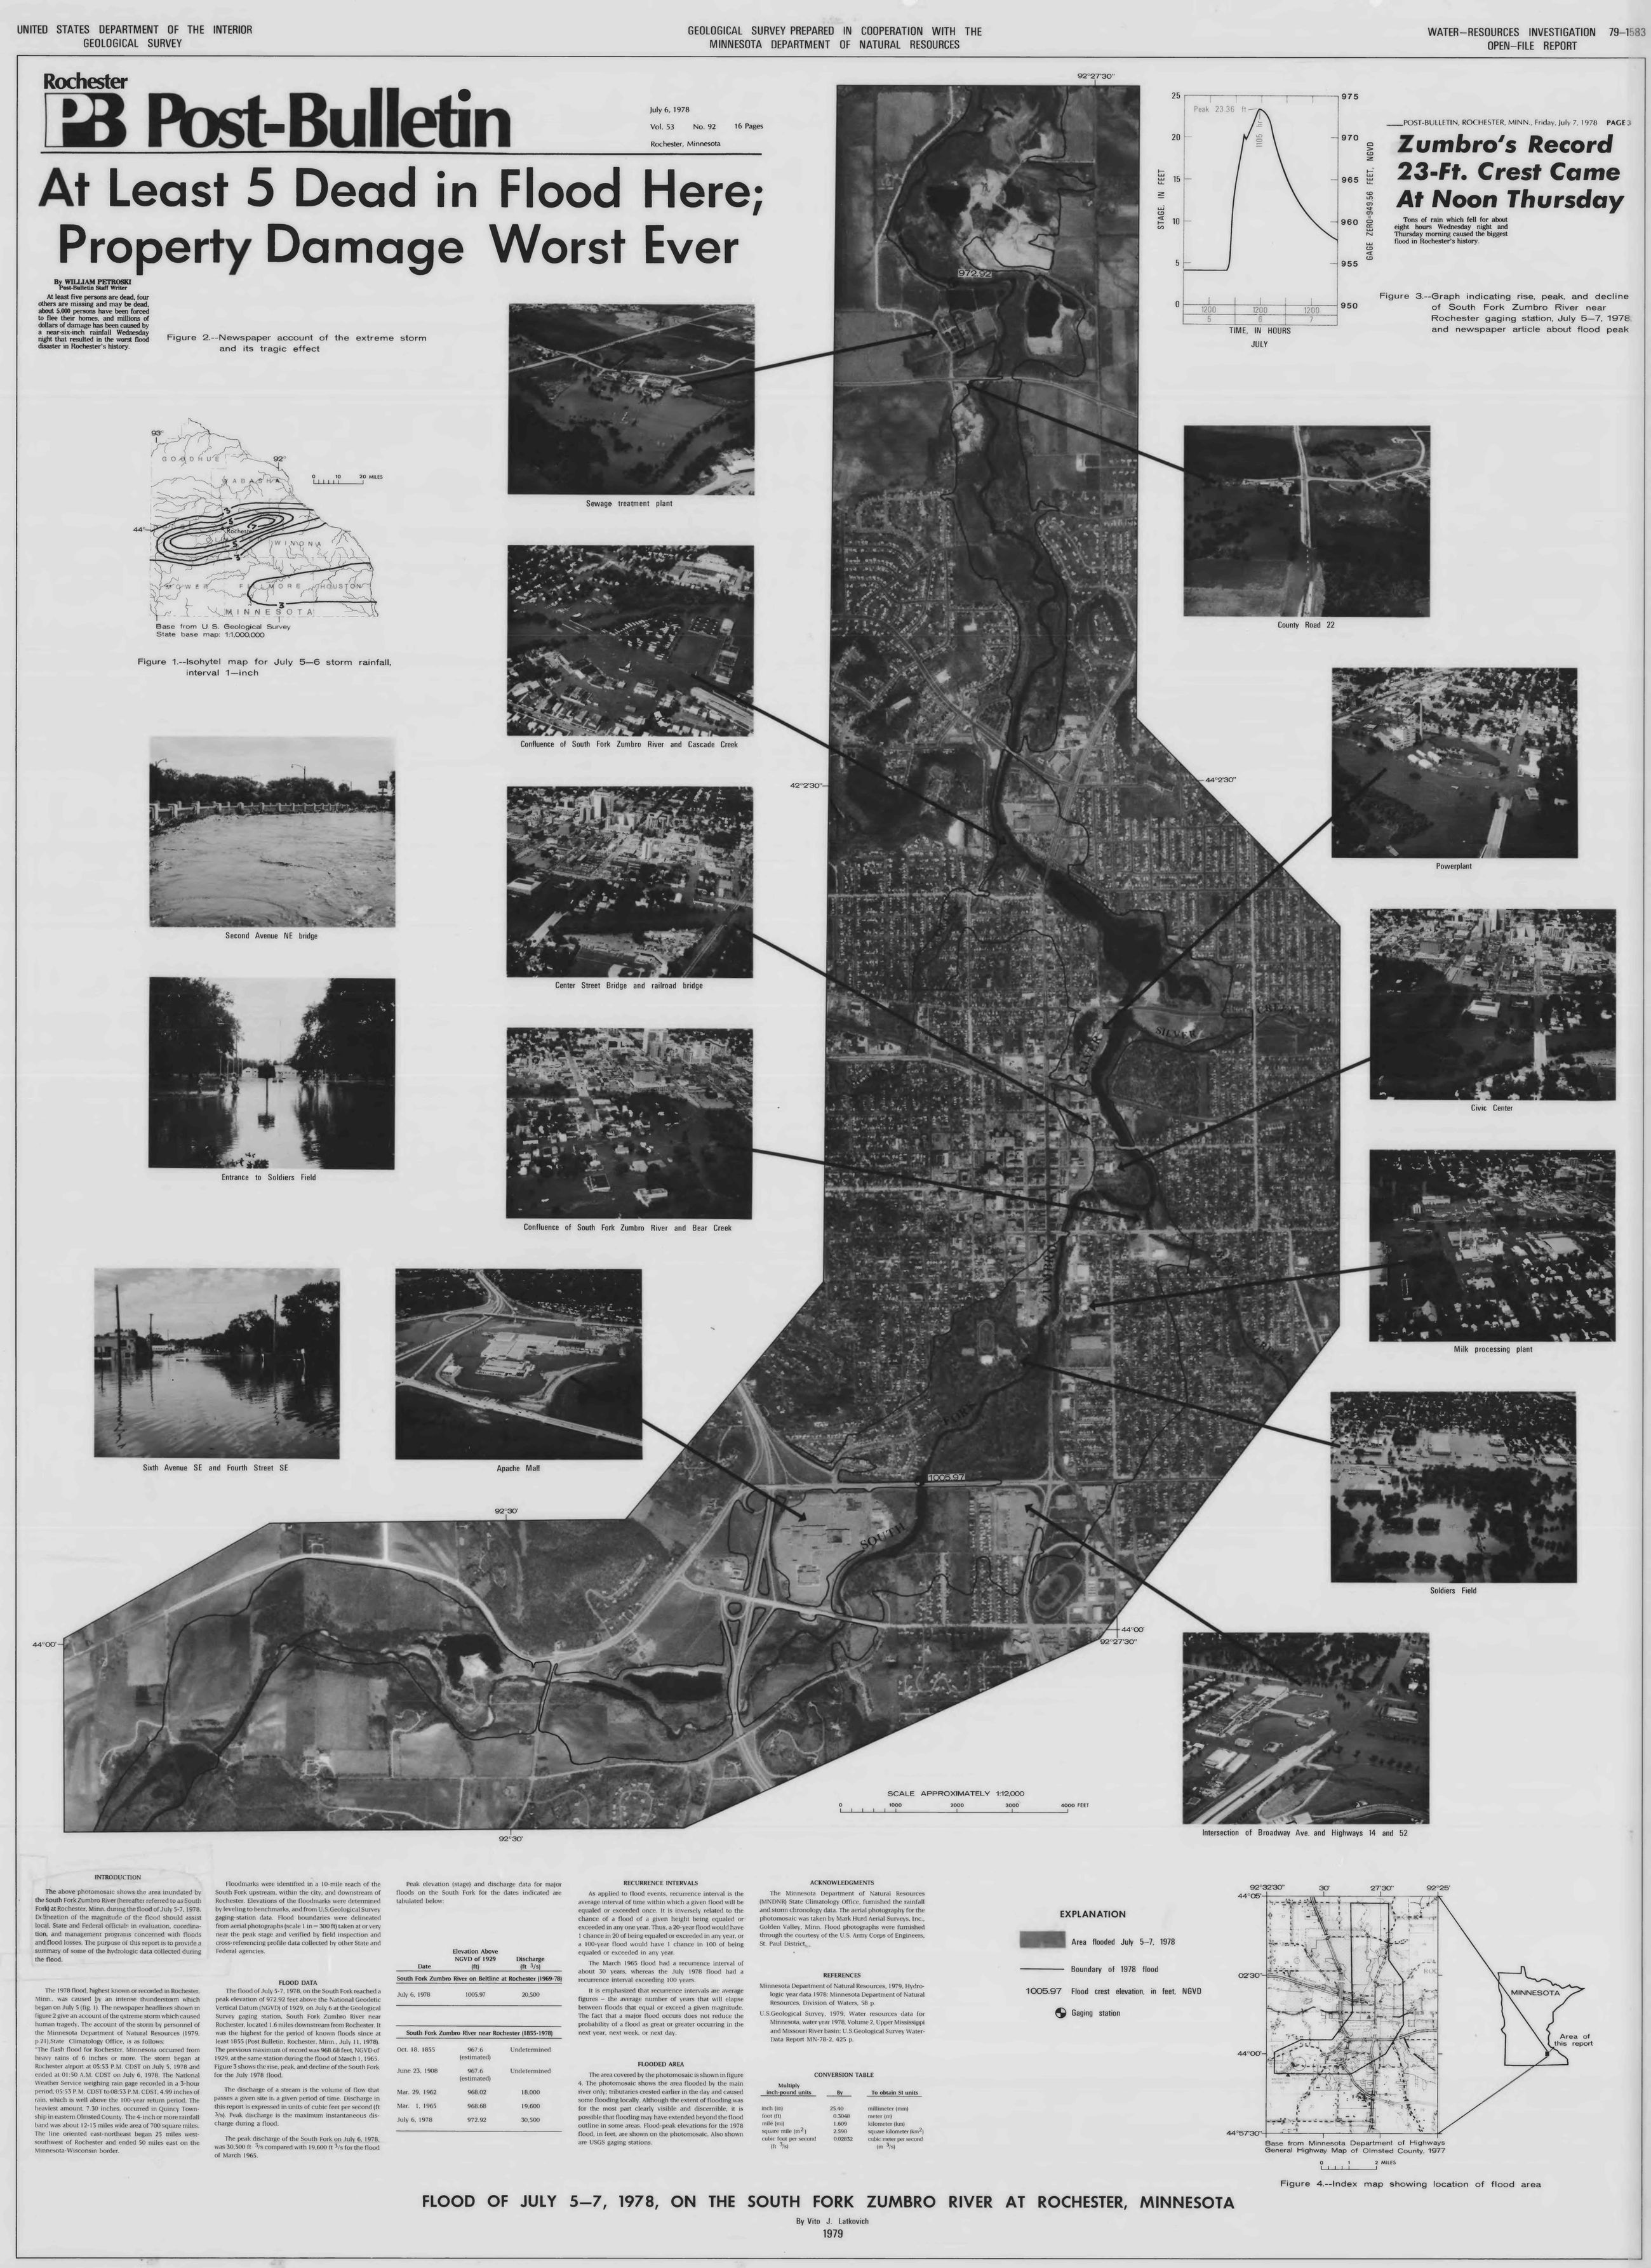
The added colors are an interpretation. They are no record of what anything looked like in July 1978, and the black-and-white plate remains the source. I would not measure anything from the colorized copy.
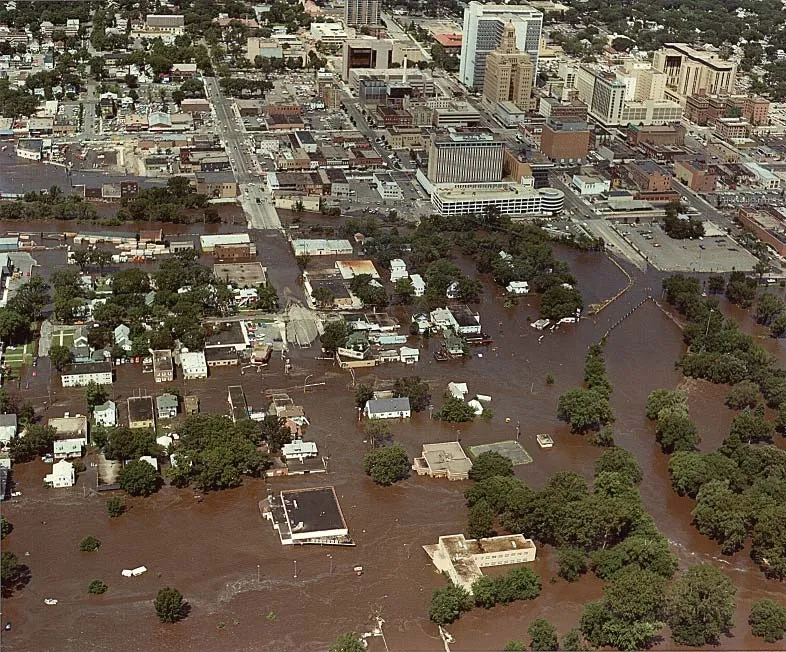
The method tints each zone of the plate and leaves the lightness of every pixel alone. I compared the two images pixel by pixel, and across all 20.9 million the lightness moved by at most half a step out of 255, which is rounding. So no label, contour, or line has shifted. The true-color photograph above is a useful check on the guess, since the Corps photographer's floodwater is the same muddy brown I chose.
Twelve days in 1978
Two rounds of rain run through this story, so here is the whole sequence before the details. A wet spell from June 29 to July 2 soaked the region. The storm that flooded Rochester came three days later, on the evening of July 5, and the river crested the next day.
- June 29 to July 2 Wet spell
Thunderstorms soak the region, and flash floods hit east and southeast Minnesota on June 30 and July 1. The Rochester airport gets 2.07 inches.
- July 3 and 4 A pause
Almost no rain falls. The South Fork drops back to 338 cubic feet per second, and the ground stays wet.
- July 5, evening The storm
Heavy rain falls through the night, and the airport total reaches 6.74 inches before it ends early on July 6.
- July 6 The crest
The South Fork reaches 23.36 feet and 30,500 cubic feet per second, the largest flood in the USGS record at Rochester.
- July 8 Disaster declaration
The President declares a major disaster covering 17 Minnesota counties, Olmsted among them.
Daily rain from NOAA's record for the airport. Daily mean flow from USGS gauge 05373000, which is why July 6 shows 20,500 cubic feet per second and the instantaneous peak was 30,500. Flash flood dates from the USGS report, page 2. Disaster declaration from FEMA.
The rain
Wednesday, July 5, 1978 was hot and humid in Rochester. The airport's hourly observers typed short coded remarks into their reports, and NOAA still keeps them. Reading them is the closest I can get to standing on that ramp. Here is the evening, with the times converted to Central Daylight Time.
| Time (CDT) | Observer's remark | In plain words |
|---|---|---|
| 6:21 to 6:35 p.m. | RB21E35 | A brief shower. It left 0.08 inch, and the temperature held near 85°F. |
| 7:08 p.m. | TB08 NW-NE OCNL LTGCG | Thunderstorm begins, northwest to northeast, with occasional cloud-to-ground lightning. |
| 7:50 p.m. | RB50 | Rain begins at the airport. |
| 7:51 p.m. | PK WND 0152/51 | Peak gust of 52 knots, about 60 mph, from the north. |
| about 7:53 p.m. | CITY OF RST RPTS GOLF BALL HAIL | Rochester reports golf ball hail. The temperature is down to 73°F. |
| 8:11 p.m. | PK WND 0260/11 | A stronger gust, 60 knots, about 69 mph. |
| 8:53 p.m. | PCPN 208 | 2.08 inches in the past hour. Thunderstorm overhead. |
| 9:53 p.m. | PCPN 157 | 1.57 inches in the past hour. |
| 10:53 p.m. | PCPN 1.38 | 1.38 inches in the past hour. |
| 4:05 a.m. | RE05 | Rain ends at the airport. |
Rochester airport hourly reports from NOAA's Integrated Surface Database, station file 726440-14925 for 1978, read with the format guide. The plain-language readings are mine.
Those three hourly amounts add up to 5.03 inches. The official figure for the heaviest three hours at the airport is 4.99 inches, from the State Climatology Office's account in the Minnesota DNR's 1979 report, page 21. The storm total at the airport was 6.74 inches, according to the National Weather Service, and NOAA's daily record adds up to the same number. In Quincy Township, east of the city, the same DNR account gives 7.30 inches, the highest total of the storm.
The rain did not spread evenly. The USGS report, page 5, describes a band of four inches or more that was only 12 to 15 miles wide and ran east-northeast for about 75 miles, right through Rochester. Heavy rain had also fallen days earlier. The airport measured about 2 inches from June 29 to July 2, and the gauge at Elgin, about 12 miles northeast of the city, had 4.28 inches on July 1 alone.
A small puzzle about the clock
The puzzle is that the published reports and the airport's own log disagree by about two hours on when the heavy rain fell.
The published time comes from the DNR's 1979 report. It says the airport's gauge recorded the 4.99 inches between 5:53 and 8:53 p.m. Daylight Time, and the USGS report and the National Weather Service repeat those times.
The airport log puts that rain later. In the table above, rain begins at 7:50 p.m., and the three big hourly amounts run from 7:53 to 10:53 p.m. Those three amounts add up to 5.03 inches, within 0.04 inch of the published 4.99, so the log and the report must be describing the same burst of rain at two different times.
Three other records side with the log:
- The airport's own six-hour rain total at 7 p.m. was 0.08 inch, far too little if a downpour had started at 5:53.
- NOAA's recording rain gauges around Rochester, in the table below, show the rain arriving in the evening. Dodge Center, 20 miles west of the airport, was dry until 9 p.m. Daylight Time.
- On the radio the next day, MPR's Terri Keefe said the rain "began last night about 7:30", going by the archive's machine transcript.
| Station | 3p | 4p | 5p | 6p | 7p | 8p | 9p | 10p | 11p | 12a | 1a | 2a | 3a | 4a | 5a | 6a |
|---|---|---|---|---|---|---|---|---|---|---|---|---|---|---|---|---|
| As published for the airport | 5:53 to 8:53 p.m. | |||||||||||||||
| Alma Dam 4, WI | 0.50 | 2.40 | 0.70 | 0.30 | 0.10 | 0.10 | 0.20 | 0.30 | ||||||||
| Trempealeau Dam 6, WI | 0.60 | 0.70 | 0.70 | 0.10 | 0.20 | 0.20 | 0.10 | |||||||||
| La Crescent Dam 7 | 0.30 | 0.49 | 0.41 | 0.13 | 0.12 | 0.17 | 0.11 | 0.19 | 0.18 | 0.03 | ||||||
| Rushford | 0.92 | 0.37 | 0.13 | 0.27 | 0.09 | 0.20 | 0.26 | 0.16 | ||||||||
| Rochester airport | 0.08 | 2.08 | 1.57 | 1.38 | 0.06 | 0.16 | 0.05 | |||||||||
| Dodge Center | 1.81 | 0.28 | 0.12 | 0.21 | 0.20 | 0.10 | 0.05 | 0.01 | ||||||||
| Spring Valley | 1.80 | 0.70 | 0.20 | 0.20 | 0.20 | 0.20 | ||||||||||
Stations run from the first hard rain to the last. Each column is the hour starting at the label. The airport's hours start at 53 minutes before the label. Striped cells are hours with no hourly amount in the log, and 0.46 inch fell across those two hours. Other stations are from NOAA's Hourly Precipitation Data, version 2, shifted from standard to daylight time.
My guess is a time-zone slip somewhere between the gauge chart and the printed report, and I cannot prove that. The published end of the rain, 1:50 a.m., fits the same radio report better than it fits the log, which shows light rain until about 4 a.m. So I would treat this as an open question. If anyone in Rochester or at the National Weather Service knows where the original forms are, I would love to see them.
Okay, let's be real. This is mostly my nerdiness showing, and when the rain started and ended matters only a little for the story. Sunset that evening was just before 9 p.m. If the log is right, most of the heaviest rain fell after dark, and the water came up through the night.
The rain on a map
The map below shows both rounds of rain in date order, so you can compare them. The storm of July 5 and 6 is the one that flooded Rochester. The wet spell was the larger rain across the region, and nClimGrid averages 4.4 inches for it over the South Fork watershed above the gauge. Even so, the river's daily flow only reached 823 cubic feet per second, because most of that rain appears to have soaked in. Three days later the same watershed had much less room left, and the storm dropped its rain far faster.
The colors come from nClimGrid, a NOAA grid built from daily gauges. The dots are individual gauges. Colors and dots are both cumulative totals for the dates on the button, and each view has its own color scale, so the same color means different amounts in the two views. On the storm view, the white lines are the storm contours from the plate, drawn in 1978, which I traced and placed on the map. Hover over the map or a dot for values, or open the list under the map for every gauge and its station number.
Zumbro River watershed South Fork watershed above the gauge Zumbro River and its forks USGS storm contours Daily gauge
Every gauge on the map, with its station number
| Gauge | Station number | June 29 to July 2, in | July 5 and 6, in |
|---|---|---|---|
| Albert Lea 3 SE | USC00210075 | 0.48 | 1.70 |
| Alma Dam 4 | USC00470124 | 5.48 | 4.75 |
| Austin Waste Water Treatment Facility | USC00210355 | 1.64 | 0.30 |
| Beaver | USC00210559 | 6.35 | 3.00 |
| Blair | USC00470882 | 4.78 | 2.05 |
| Caledonia | USC00211198 | 6.78 | 2.17 |
| Dodge | USC00472165 | 5.77 | 2.64 |
| Dorchester | USC00132311 | 4.84 | 1.50 |
| Elgin 2 SSW | USC00212486 | 5.02 | 3.23 |
| Faribault | USC00212721 | 1.61 | 0.66 |
| Galesville 2 WSW | USC00472996 | 5.25 | 2.85 |
| Genoa Dam 8 | USC00473038 | 7.43 | 0.71 |
| Grand Meadow | USC00213290 | 3.07 | 2.63 |
| Harmony | USC00213520 | 1.36 | 2.93 |
| La Crescent Dam 7 | USC00214418 | 7.63 | 2.05 |
| La Crosse Regional Airport | USW00014920 | 6.92 | 1.93 |
| Lake City | USC00214438 | 7.95 | 0.80 |
| Lanesboro | USC00214563 | 1.66 | 2.75 |
| Minnesota City Dam 5 | USC00215488 | 6.71 | 5.30 |
| Mondovi | USC00475563 | 3.78 | 0.85 |
| Owatonna | USC00216287 | 1.54 | 1.05 |
| Preston | USC00216654 | 1.44 | 3.41 |
| Red Wing | USC00216817 | 9.88 | 0.59 |
| Rochester airport | USW00014925 | 2.07 | 6.74 |
| Spring Grove | USC00217915 | 5.06 | 4.58 |
| Theilman 1 SSW | USC00218227 | 10.00 | 1.17 |
| Trempealeau Dam 6 | USC00478589 | 6.88 | 2.78 |
| Wabasha | USC00218552 | 4.94 | 1.43 |
| Waseca Southern Research And Outreach Center | USC00218692 | 0.47 | 0.90 |
| Winona | USC00219067 | 5.28 | 1.95 |
| Winona Dam 5 A | USC00219072 | 6.01 | 1.97 |
| Zumbrota | USC00219249 | 2.20 | 0.68 |
nClimGrid is useful for seeing where the rain went, but its values will not match the gauge record, for a simple reason. A gauge measures rain at one point. nClimGrid estimates the rain over a cell about 5 km wide by interpolating between daily gauges, and in 1978 those gauges sat far apart compared with a band 12 to 15 miles wide. The narrow core of the storm fell between them, so the grid spreads it out and flattens it. The airport's cell shows 3.34 inches against the 6.74 measured there, and the highest cell on the whole map is 3.77. The grid's 3.1-inch average for the storm over the South Fork watershed runs low for the same reason.
The 1978 analysts had something better. The DNR says its rainfall map for this storm drew on 64 reports from Future Farmers of America members and 16 from the National Weather Service. I love that detail. A hand-drawn map built on reports from farm country still shows this storm more sharply than the national grid does. I would have used NOAA's AORC hourly grid, as I did for my Minnesota rain and snow post, but it starts in February 1979, seven months too late.
How rare the rain was
The 1979 DNR report called the 4.99 inches "well above the 100-year return period." Today's reference is NOAA Atlas 14, which gives a 3-hour depth at the airport of 4.50 inches for the 50-year event and 5.22 for the 100-year event. By that measure the airport's burst falls between the two. That comparison is mine, it is for one point and one duration, and the Atlas carries a wide confidence interval.
Whatever number you put on the rain, the flood was catastrophic, and USGS rated it beyond the 100-year level. Rochester is a textbook example of why rainfall frequency and flood frequency are different things. A river responds to the rain and to the state of the ground it lands on, and here the wet spell had already primed the soil. The USGS report, page 1, says the July storms were "combined with wet antecedent soil-moisture conditions of late June." The rain also landed in the right place to do damage. The DNR report, page 15, says more than 5 inches fell in 3 hours "along and through the headwaters of all the streams above Rochester."
The river
The main record comes from USGS station 05373000, on the South Fork Zumbro River 1.6 miles downstream of the city. The chart below shows the river's stage, which I digitized from the graph printed on the plate, so read it as a tracing of a published figure. The map with it shows where the gauge sits. USGS keeps daily mean flows for it, 733 cubic feet per second on July 5, 20,500 on July 6, and 4,040 on July 7. For the shape of the rise within a day, this graph is the only record I have found.
Digitized from Figure 3 of the USGS plate. Flood stage is the value the National Weather Service gives for this historical gauge.
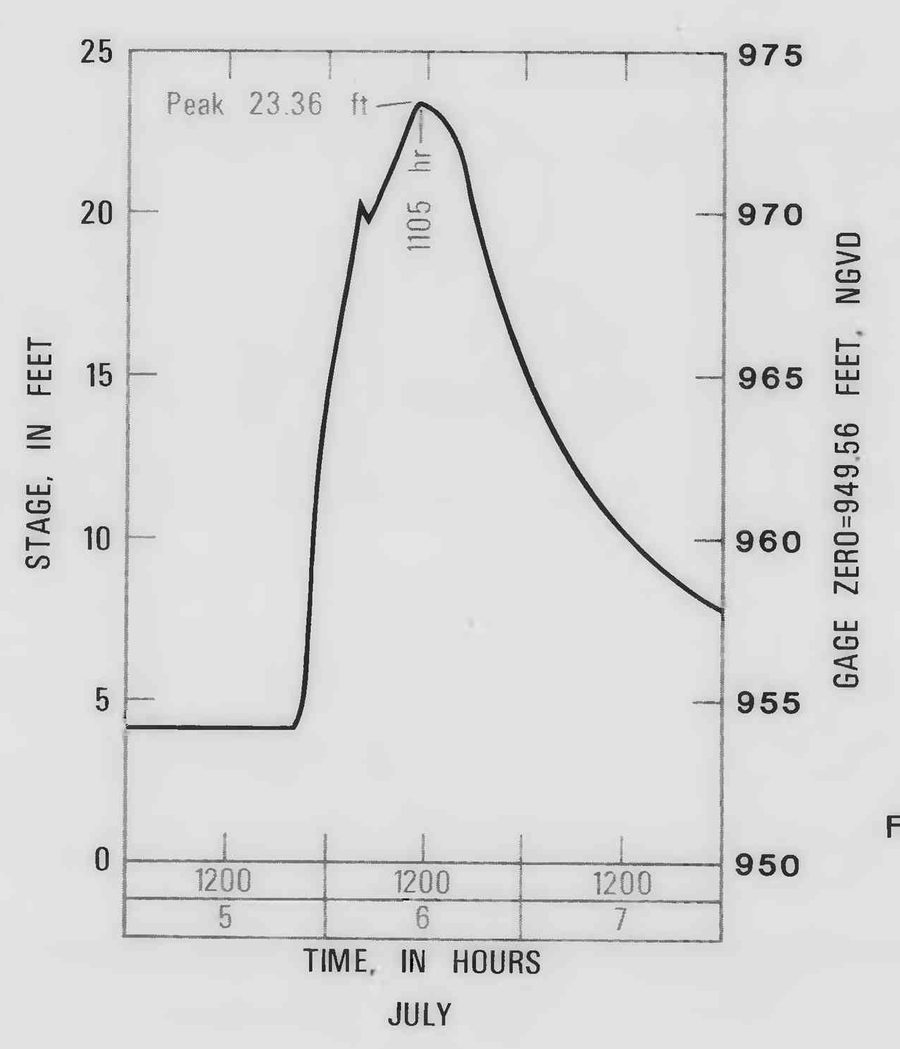
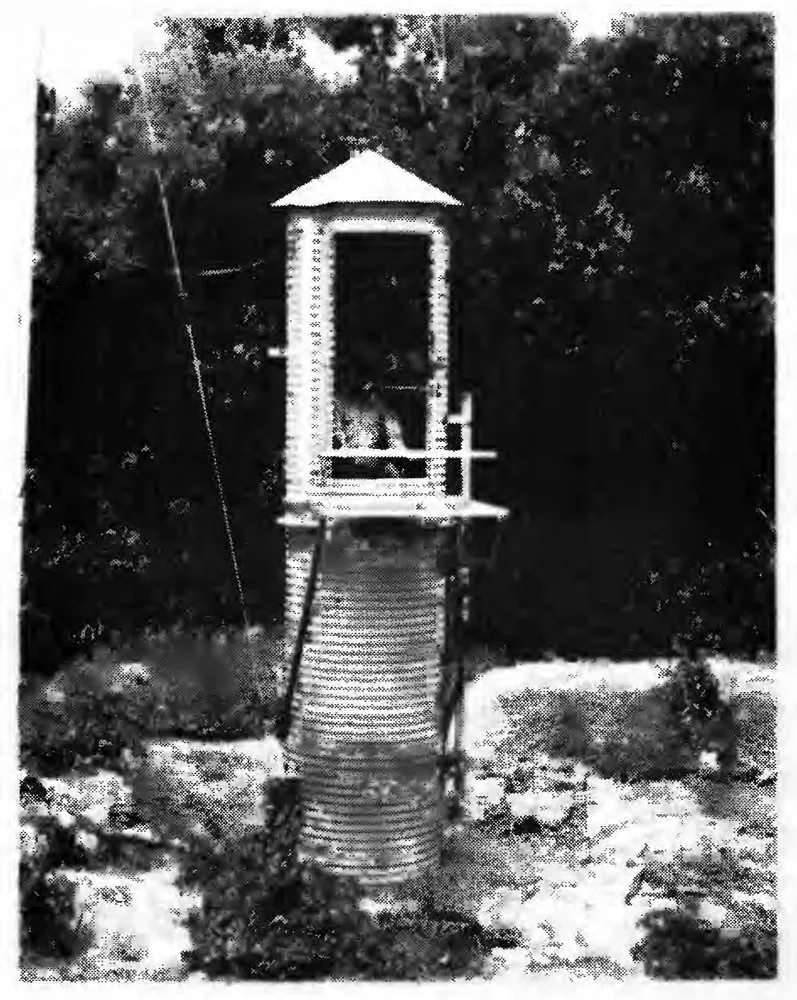
The river sat at about 4 feet that evening and crested at 23.36 feet on Thursday, July 6. It is easy to misread that number. It is a water level at a gauge, measured from the gauge's own zero, and it does not mean the city stood under 23 feet of water. The National Weather Service gives 12 feet as flood stage at that gauge, and describes water 6 feet deep or more across about a quarter of the city.
Peak flow was 30,500 cubic feet per second, against 19,600 in March 1965, the largest flood before it. A flood plain report from 1975 had put the 100-year flow at this gauge at 27,500, and USGS rated 1978 beyond a 100-year flood, using the record available then. The plate reminds readers that a large flood does nothing to lower the chance of another one next year, next week, or next day.
Even the crest has three times attached to it. The plate's graph says 1105 hours. The Post-Bulletin headline on the same plate says noon, and USGS says its aerial photographs of the peak were taken about noon. The National Weather Service says 10 a.m. If the gauge record is on standard time, as USGS records often are, 1105 hours and noon nearly agree.
The tributaries came first. The plate warns that its mapped boundary shows the main river only, and that creeks crested earlier and flooded their own neighborhoods. The number that stopped me is Bear Creek. It peaked at 24,900 cubic feet per second that day from a watershed of 80 square miles, while the whole South Fork carried 30,500 from 304 square miles. That is about 311 cubic feet per second for each square mile of Bear Creek and about 100 on the South Fork. The two peaks came at different times, so they do not add. The USGS report, page 14, notes that the Corps of Engineers put Bear Creek near a 500-year event, and the 1975 report had estimated its 100-year flow at 13,100.
Peaks from USGS 05372930 and 05372995. Estimates from Table I.1 of the 1975 report, at the USGS gauge and at the mouth of Bear Creek (82.3 square miles).
Where the water went
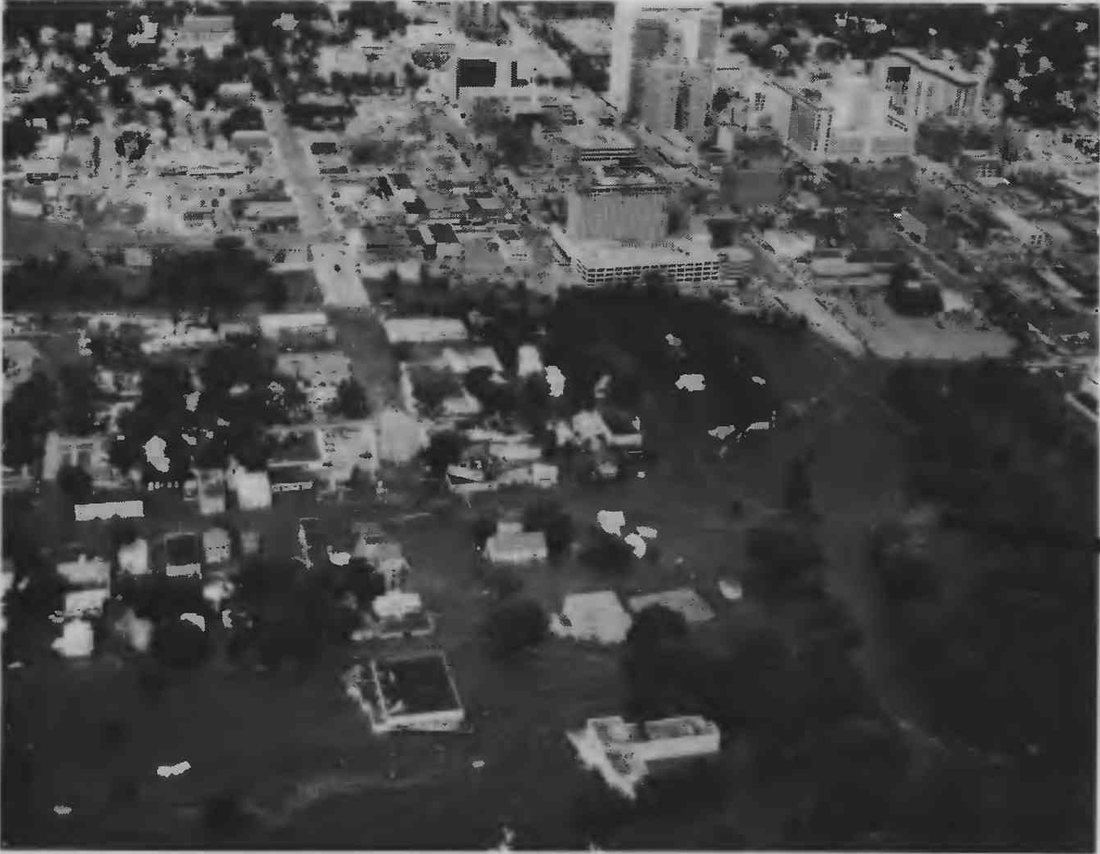
This is the part I most wanted to build. USGS flew the river at about the time of the crest and drew the edge of the water on the photographs. I placed that mosaic on a live map over current USGS imagery. The dark shading and the thin black line are the flooded area as USGS mapped it. Slide the control to fade from 1978 to today, and click a gold dot or a thumbnail to see the photograph from that spot.
Photographs and mosaic from USGS Open-File Report 79-1583. The plate credits the flood photographs to the U.S. Army Corps of Engineers, St. Paul District, and the aerial photography to Mark Hurd Aerial Surveys. Black diagonal lines on the mosaic are the plate's own leaders to its photographs.
The plate cautions that water may have reached beyond the line in some places. The line shows the main river, and it is no modern regulatory floodplain.
The people
The USGS summary of the plate says the flood claimed at least 5 lives and forced 5,000 people from their homes. The National Weather Service gives the details, and puts the number displaced at nearly 5,000. Four people drowned when they were trapped in a nursing home elevator, a nurse's aide and three patients in wheelchairs. A fifth person died when her car went off County Road 10 southwest of Rochester. MPR reported the same five deaths the day of the flood, and Mayo Clinic's history also counts five. The one source I found that differs is the DNR's 1979 report, which says 4.
The National Weather Service account estimates that 80 percent of the city lost power, and it records that the sewage treatment plant was out of commission and that several bridges were swept away. Mayo Clinic's history recalls Saint Marys Hospital, already full, taking in people who needed shelter. The President declared a major disaster two days after the crest, on July 8, covering 17 Minnesota counties, Olmsted among them.
I went looking for one damage figure and found a range. The mayor said $30 to $40 million on the radio that first day. The Corps history says $60 million, and the State Climatology Office said over $100 million. Those were counted at different times and on different terms, and I have not tried to reconcile them.
I keep coming back to the photographs of ordinary places. A flooded park entrance is still a park entrance. A road intersection is still somewhere people needed to get through. We spend a lot of time at floodplain conferences on elevations, models, and maps. Reading about Rochester is a good reminder to ask what those numbers mean for someone trying to get home, keep a business open, or reach a person who needs help.
Documents from before and after the flood
Rochester's flood control story is long, and the people who lived it can tell it better than I can. If you want to follow it yourself, these are the documents I found most useful, in date order.
Before the flood
- Flood plain information supplemental report, South Fork Zumbro River and tributaries, Rochester (1975). Updates the Corps of Engineers' 1968 flood plain study. It gives 100-year flows and flood profiles for the river and its creeks, a floodway plan, and a description of the Corps plan and the seven headwater dams under study at the time.
After the flood
- USGS Open-File Report 79-1583 (1979). The plate this post is built on, with the flooded area, photographs, rainfall map, and river graph.
- USGS Open-File Report 79-1166 (1979). Flood data for 34 gauges across southeast Minnesota and southwest Wisconsin, with the storm accounts and more photographs.
- Minnesota DNR hydrologic data for 1978 (1979). Rainfall maps for each of the year's flash floods, including a second Rochester flood on September 12 with 7.07 inches downtown.
- Laws of Minnesota 1983, chapter 14. Lets Olmsted County and the Olmsted County Soil and Water Conservation District carry out flood control work in the South Fork watershed under a joint powers agreement with the city.
- Water Resources Development Act of 1986, section 401(a). Authorizes the federal project for the South Fork Zumbro River at Rochester, based on a Chief of Engineers report dated February 23, 1979.
- Steward of Headwaters, the St. Paul District's history of itself, pages 96 to 101. The Corps' account of the project, from its first study in 1936 through construction, local funding, design changes, and public response.
- City of Rochester stormwater page and South Zumbro capital improvement project summary. The City's description of the system today, with its list of upstream reservoirs.
- Flood Mitigation Study, Zumbro River Watershed (2013). A Minnesota State University, Mankato study of flood mitigation across the whole watershed, prepared for the state.
The USGS peak record gives the longer view. In 75 years the 1978 peak still stands alone, and the next largest are 19,600 in 1965 and 18,000 in 1962.
USGS peak streamflow, station 05372995. Hover over a bar for the date, discharge, and gauge height.
Work on the river continues. Silver Lake, the dark bulge in the river on the plate, is being drawn down this fall so the old low-head dam can become a rock arch rapids, due by September 2027. The field tour photos near the top of this post show it on November 4, with the lake drawn down and the excavators at work on the dam.
The data, and how far to trust it
Here is where each number and map layer came from, with direct links to the files where I could.
- Storm contours and the stage curve are my tracings of Figures 1 and 3 of the USGS plate, so they carry the error of the print and of my tracing. I placed the contours using the plate's latitude and longitude marks, good to about a mile.
- Map colors are NOAA nClimGrid-Daily, from the June and July 1978 files. NOAA advises against reading individual grid points or days closely. Each map adds the grid days listed on its button, because an observer's day ends in the morning and a storm can land on either date.
- Gauge totals come from the ACIS service. They add the same calendar dates, and observers read their gauges at different hours. Trace amounts count as zero. Station numbers on the map are NOAA's Global Historical Climatology Network IDs, which you can look up in NOAA's daily summaries.
- The airport's hourly remarks are the observers' own, from the Integrated Surface Database file, and they total less than the official storm figure. By morning they reach about 5.8 inches, against the official 6.74, and I cannot account for the difference. I read them for timing and shape.
- Hourly amounts at the other stations are from NOAA's Hourly Precipitation Data files for Alma Dam 4, Trempealeau Dam 6, La Crescent Dam 7, Rushford, Dodge Center, and Spring Valley.
- River numbers are from USGS: daily mean flows at 05373000, annual peaks at 05372995, and annual peaks at 05372930 on Bear Creek.
- The 3-hour rainfall depths are from the NOAA Atlas 14 table for the airport.
- Watershed outlines come from the Watershed Boundary Dataset, HUC 07040004 for the whole Zumbro, and USGS's Network Linked Data Index for the South Fork above the gauge. River lines are from the National Hydrography Dataset.
- The "1-in-so-many-years" labels in this post come from their sources. I did no new flood-frequency analysis.
- Map colors use Nasir from Rang, my palette collection.
There are more photographs than I could use. The National Weather Service page has six from the City of Rochester, and the Minnesota Historical Society holds 81 Corps of Engineers photographs dated July 6, 1978.
Sources
- Latkovich, V. J. (1979). Flood of July 5-7, 1978, on the South Fork Zumbro River at Rochester, Minnesota. USGS Open-File Report 79-1583, prepared with the Minnesota DNR. Plate 1.
- Latkovich, V. J. (1979). Hydrologic data for floods of July 1978 in southeast Minnesota and southwest Wisconsin. USGS Open-File Report 79-1166.
- National Weather Service, La Crosse. Summer of 1978: Flash Floods.
- Minnesota DNR. Hydrologic data for 1978, with the State Climatology Office storm account. See also the DNR's list of mega-rains.
- U.S. Geological Survey. Peak streamflow for station 05372995, South Fork Zumbro River at Rochester, station 05372930, Bear Creek at Rochester, and daily flow for station 05373000.
- NOAA NCEI. Integrated Surface Database, station 726440-14925, Rochester. Hourly Precipitation Data, version 2. nClimGrid-Daily. Daily gauge records through the Applied Climate Information System.
- Perica and others (2013). NOAA Atlas 14, Volume 8, Precipitation-Frequency Atlas of the United States, Midwestern States.
- Flood plain information supplemental report on South Fork Zumbro River and tributaries, vicinity of Rochester, Minnesota. Minnesota DNR, Division of Waters, with plates dated October 1975.
- U.S. Army Corps of Engineers, St. Paul District. Steward of Headwaters: U.S. Army Corps of Engineers, St. Paul District, 1975-2000, pages 96 to 101.
- City of Rochester. Stormwater, South Zumbro capital improvement project, and Silver Lake project notice.
- Laws of Minnesota 1983, chapter 14. Water Resources Development Act of 1986, Public Law 99-662, section 401(a).
- Druschel, S. J., and others (2013). Flood Mitigation Study, Zumbro River Watershed, Minnesota. Minnesota State University, Mankato.
- MPR News. Reports on Rochester flooding, July 6, 1978, machine-generated transcript. Mayo Clinic. Values history, chapter 9. FEMA. DR-560.
- Map layers from USGS The National Map, the Watershed Boundary Dataset, and the National Hydrography Dataset.
If you remember 1978, or you know this river well, I would love to hear about it. A technical report can keep
measurements and photographs. It cannot tell the whole story of what a flood meant to a city. And to everyone I
met in Rochester, thank you for the conversations, the tour, and the award.
Mohsen :)